i have not seen an "Abandoned Baby" on a currency before, but I maybe spoted one, on ten year treasury note ?
Is this an "Abandoned Baby", and how will it effect the currencys ?
Best wishes
Ignored
hi dear peaches
you can explain me about you use from what software (U.S. Treasuries 10 year YIELD) ?
it's interesting because this software give to you candlestick chart for U.S. Treasuries no line chart
hi dear peaches
you can explain me about you use from what software (U.S. Treasuries 10 year YIELD) ?
it's interesting because this software give to you candlestick chart for U.S. Treasuries no line chart
On G/J daily, i think we have yesterday (monday) seen a bearish harami pattern:
Bearish Harami Pattern is a two-candlestick pattern composed of a small black real body contained within a prior relatively long white real body. “Harami” is an old Japanese word for “pregnant”. The long white candlestick is “the mother” and the small candlestick is “the baby”. Recognition Criteria:
1. Market is characterized by an uptrend.
2. We see a long white candlestick on the first day.
3. Then we see a black candlestick on the second day whose real body is completely engulfed by the real body of the first day. The shadows (high/low) of the second candlestick do not have to be contained within the first body, though it's preferable if they are. Explanation:
The Bearish Harami Pattern is a sign of a disparity about the market’s health. Bull market continues further confirmed by the long white real body’s vitality but then we see the small black real body which shows some uncertainty. This shows the bulls’ upward drive has weakened and now a trend reversal is possible. Important Factors:
It is important that the second day black candlestick has a minute real body relative to the prior candlestick and that this small body is inside the larger one. The Bearish Harami Pattern does not necessarily mean a market reversal. It rather predicts that the market may not continue with its previous uptrend. There are however some instances in which the Bearish Harami Pattern can warn of a significant trend change - especially at market tops.
|
Joined Jun 2008
|
Status: KISS=Keep it simple and Stupid
|131 Posts
Hi Hussin and members
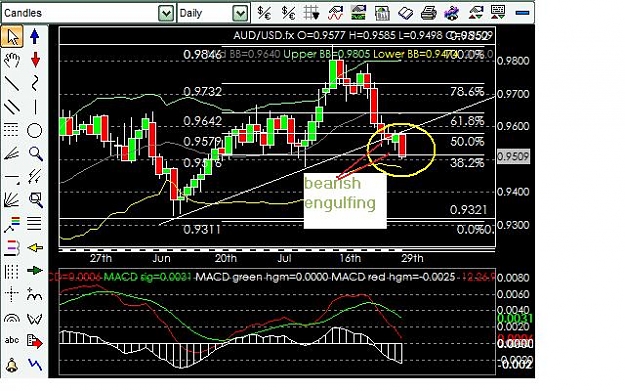
I see signal for bearish engulfing AU.
If gold break down under 917 ,consider short AU under 095.
I see it can move to 093.wait and see.
hmmm,take care and see some MK sentiment confirmations
G day and G trade
On gold I see a Bearish Falling Three Methods Pattern. It has high reliability.
This means we will see a pinbar on the monthly for gold. So, heavy short on gold
There is a massive usd buying, and eur selling. I hope, this will last for the next 3-4 weeks
Hussin, please, what do you think ?
The Bearish Falling Three Methods Pattern is a continuation pattern, which shows a temporary break in the trend of prices without causing a reversal. The pattern is characterized by a long black candlestick during a downtrend, which is then followed by small consecutive small bodies that look like a short uptrend. It is better if all the bodies of these three days are white however they can also be of mixed color. These small bodies however must all remain within the high-low range of the first day's black candlestick. The pattern is completed by a long black candlestick, closing at a new low and showing that bears are finally taking over. The small uptrend between two long black days simply shows a market break. After this temporary break, the downward trend continues. Recognition Criteria:
1. Market is characterized by downtrend.
2. We see a long black candlestick in the first day.
3. We then see three small real bodies defining a brief uptrend on the second, third, and fourth days. However these bodies stay within the range of the first day.
4. Finally we see a long black candlestick on the fifth day opening near the previous day’s close and also closing below the close of the initial day to define a new low. Explanation:
The Bearish Falling Three Methods Pattern is a continuation pattern marked with a temporary break in the overall trend of prices without causing a reversal. The temporary break shows that there is some doubt about the ability of the trend to continue. This doubt increases as the small-range reaction days take place. However, given the fact that a new high cannot be made, the bearishness is resumed and new lows are set quickly. Important Factors:
The high-low range includes the shadows.
The reliability of this pattern is very high. However, a confirmation in the form of a black candlestick with a lower closing is still suggested.
in the daily candle chart NZDUSD,we have seen a play of good from beaarish long legged doji in the past days and in continuation we see power bears with a beaish falling three methods .
now NZDUSD is bears maintain control.
i see below 1.7340 NZDUSD
Hi Hussin and members
I see signal for bearish engulfing AU.
If gold break down under 917 ,consider short AU under 095.
I see it can move to 093.wait and see.
hmmm,take care and see some MK sentiment confirmations
G day and G trade
On gold I see a Bearish Falling Three Methods Pattern. It has high reliability.
This means we will see a pinbar on the monthly for gold. So, heavy short on gold
There is a massive usd buying, and eur selling. I hope, this will last for the next 3-4 weeks
Hussin, please, what do you think ?
The Bearish Falling Three Methods Pattern is a continuation pattern, which shows a temporary break in the trend of prices without causing a reversal. The pattern is characterized by a long black candlestick during a downtrend, which is then followed by small consecutive small bodies that look like a short uptrend. It is better if all the bodies of these three days are white however they can also be of mixed color. These small bodies however must all remain within the high-low range of the first day's black candlestick. The pattern is completed by a long black candlestick, closing at a new low and showing that bears are finally taking over. The small uptrend between two long black days simply shows a market break. After this temporary break, the downward trend continues. Recognition Criteria:
1. Market is characterized by downtrend.
2. We see a long black candlestick in the first day.
3. We then see three small real bodies defining a brief uptrend on the second, third, and fourth days. However these bodies stay within the range of the first day.
4. Finally we see a long black candlestick on the fifth day opening near the previous day’s close and also closing below the close of the initial day to define a new low. Explanation:
The Bearish Falling Three Methods Pattern is a continuation pattern marked with a temporary break in the overall trend of prices without causing a reversal. The temporary break shows that there is some doubt about the ability of the trend to continue. This doubt increases as the small-range reaction days take place. However, given the fact that a new high cannot be made, the bearishness is resumed and new lows are set quickly. Important Factors:
The high-low range includes the shadows.
The reliability of this pattern is very high. However, a confirmation in the form of a black candlestick with a lower closing is still suggested.
Ignored
hi peaches
a bearish continuation pattern with high reliability
agree with u