Price did not have a close below support. Even if it did, it would not mean much. Supports and resistances should not be adressed as round numbers. Even if price closes above or below such level, doesn't really mean a valid break. Thus the chart below.
I see support @ 136.63, not 139.03...
A very strong ascending channel. Price bounce of that channel today and is probably going up.
yes... But I consider the Price action at this level... seems like a high resistance level... and we have a pin daily bar... I'm not long for now...
Ignored
If you look into higher TFs, monthly for example, you should see somethig like an asc. channel. However, price touched the UTL of that channel lately.
So I guess we sould be looking for a retracement down towards the LTL in the long run
On daily (intra-day), price is temporarily stuck in between support @1.5871 and res. @1.5987.
Also, we are inside an asc. channel, wedge.
So we could possibly see price going to and from these S/Rs and once it bounces from the LTL of the asc. channel, it should go back up considerably.
Possible profits inside this range... alias, very safe trades inside this range... not too many pips/trade, one can make a lot of pips from many trades.
I'm not trading at the moment, I just want to hear some thoughts on what you other traders think about the EU hitting 1.61 before it goes down like everyone is hoping or expecting the Euro to do. Any comments will be appreciated.
I agree in principal booktimes, I too find it amusing to sit back and watch the bias on this forum, not just this thread alone either. All it does is prove that most have little knowledge of what is going on in the "bigger picture".
Bloomberg BTW is not all crap, you just need to know how to disseminate the information given. Not listen to and act on every "expert" opinion. Remember, opinions are like arse holes, everyone has one.
Information like freddie's fanny going under is invaluable. Information like Trichet jawboning that the Euro is overvalued is also priceless information and should NOT be taken with a grain of salt.
For any of you that have been around long enough, take yourself back to the range in late 2007. When the price broke 1.4966 resistance, it shot off like a rocket, and well, here we are today at 1.60. This tells you that the big players had their buy stops above this and the price action certainly confirms this.
The break above 1.60 was clearly short term, the big players do not have buy stops there as they did above 1.49, they have sell limits! And as we saw, the price was smashed on the head with a hammer once it surpassed 1.6030.
This should be telling you that the price is going to have great difficulties in going any higher unless the big players start putting their buy orders there. Trichet's overvalued Euro jawbone is what the big players have in the back of their minds as it is the first step central banks will take in market intervention.
We are only small fish in the big sea here and to be a successful trader, you need to ride the wash from the "big fish".
Price action tells you where the big fish are lurking. I suggest you all start listening to it.
If you look into higher TFs, monthly for example, you should see somethig like an asc. channel. However, price touched the UTL of that channel lately.
So I guess we sould be looking for a retracement down towards the LTL in the long run
On daily (intra-day), price is temporarily stuck in between support @1.5871 and res. @1.5987.
Also, we are inside an asc. channel, wedge.
So we could possibly see price going to and from these S/Rs and once it bounces from the LTL of the asc. channel, it should go back up considerably.
Possible profits inside this range... alias, very safe trades inside this range... not too many pips/trade, one can make a lot of pips from many trades.
I hope this makes sense to you.
Beter have a look at the charts...
Cheers.
Ignored
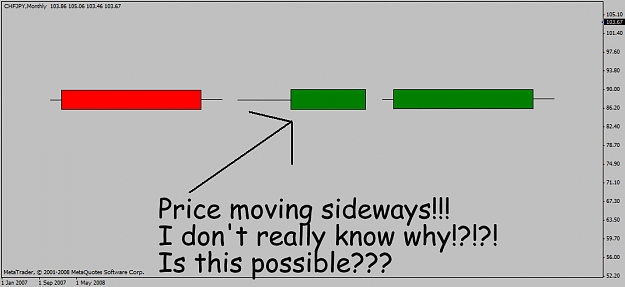
Pay close attention to the monthly chart. A smart dude called Jacko once said:
"If price is hanging around a support or resistance level, it’s likely to break in the opposite direction."
Looks like the price hanging around resistance like flies on a sheep's fly blown backside