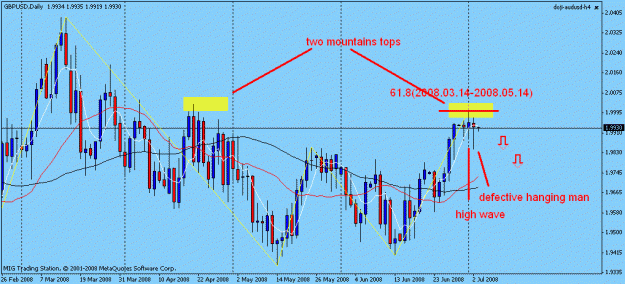
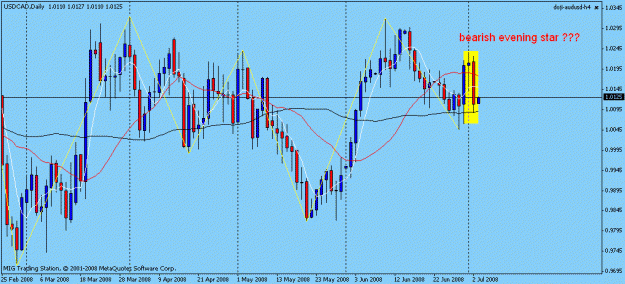
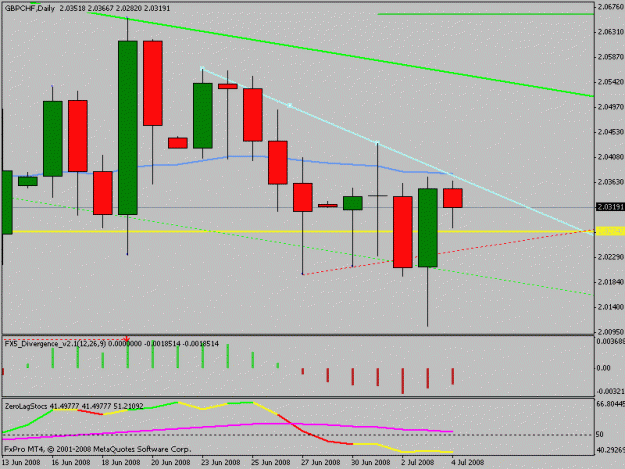
high wave show to us a signal inversion and evan we after this candle see a hanging man .
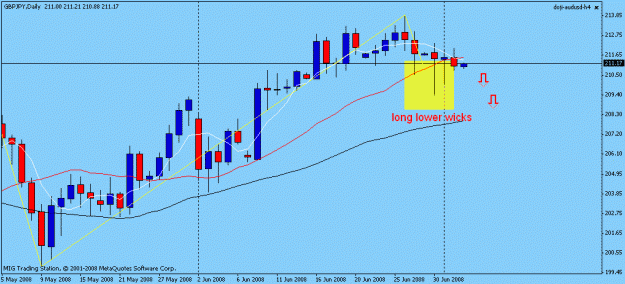
attention to long lower wick hanging man also two mountains tops
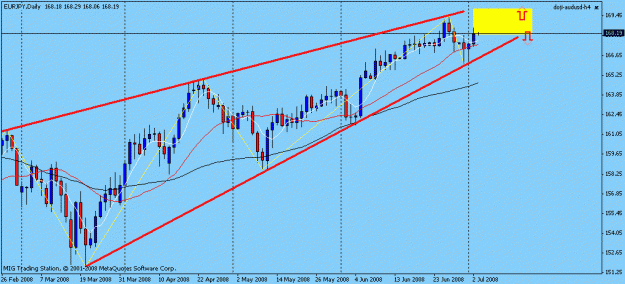
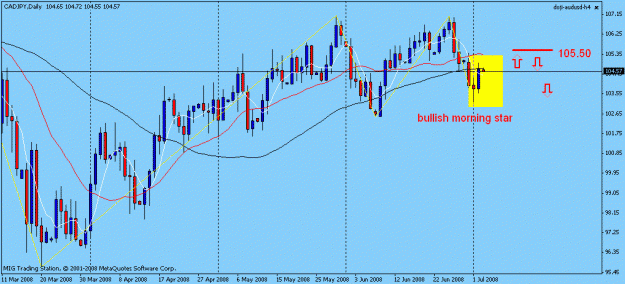
Daily Candle On Chart Indicator? 9 replies
Daily Chart 3-Candle 1,371 replies
Weekly chart with daily candle patterns 2 replies
Day's first H4 candle correlation to daily candle 14 replies
Correlation between first 4 hour candle and daily candle 1 reply
Dislikedin the weekly candle chart below we see a kabuse pattern.of course we must attention to upper wick (hit with 61.8)Ignored
DislikedGREAT ANALYSIS ....100% AGREEMENT...i really is nice to see post which i can totally relate to, the candle formation is definately berish assuming the weekly closes where it is now ..id love for it to try and test the top 2.0 area where the fib 61.8 is and sell ...great analysis friend
which is every possibilty , testing the top i thinkIgnored
DislikedBT
attention to 10-YEAR U.S YIELD also 2-YEAR Germanyin the next weekIgnored
Dislikedhello hussin,
do you know the symbol for 2-YEAR yield Germany ?
For 10-YEAR U.S YIELD it is "^TNX". I see a trendline break, and a stochachstics crossing to the downside late june for this. So unwinding might be in play.
Ignored
Dislikedsome might think, that the last green candle is a bullish engulfing, but from what i see it is not a bullish engulfing. The lower part of the body of the green candle is HIGHER than the lower part of the red candle (the day before the green candle). To be a bullish engulfing the green candle has to have a lower candle-bottom).
So, the shorts below the blue trendline are a good choice (and a SL above), baby trader knows, my first target is 2.00.Ignored
Dislikedhello hussin,
do you know the symbol for 2-YEAR yield Germany ?
For 10-YEAR U.S YIELD it is "^TNX". I see a trendline break, and a stochachstics crossing to the downside late june for this. So unwinding might be in play.
Ignored