• Home
  • Forums
  • Trades
  • News
  • Calendar
  • Market
  • Brokers
  • Login
  • Join
  • User/Email: Password:
  • 12:48am
Menu
  • Forums
  • Trades
  • News
  • Calendar
  • Market
  • Brokers
  • Login
  • Join
  • 12:48am
Sister Sites
  • Metals Mine
  • Energy EXCH
  • Crypto Craft

Options

Bookmark Thread

First Page First Unread Last Page Last Post

Print Thread

Similar Threads

4 Hour Strategy Macd+other Indicator 21 replies

average true range for 1 hour and 4 hour charts 2 replies

X-1102 1 hour , 4 hour and daily Tf trades 7 replies

Create a verticle line at certain hour for every certain hour 16 replies

Is the "4 Hour Strategy (MACD)" the best system here at FF? 20 replies

  • Commercial Content
  • /
  • Reply to Thread
  • Subscribe
  • 12,921
Attachments: 4 Hour Strategy (MACD)
Exit Attachments

4 Hour Strategy (MACD)

  • Last Post
  •  
  • 1 767768Page 769770771 1578
  • 1 Page 769 1578
  •  
  • Post #15,361
  • Quote
  • Jun 5, 2008 11:29am Jun 5, 2008 11:29am
  •  fena74
  • | Joined Nov 2007 | Status: Member | 76 Posts
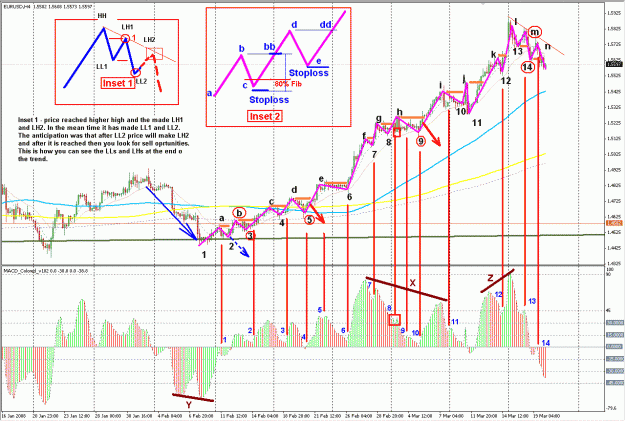
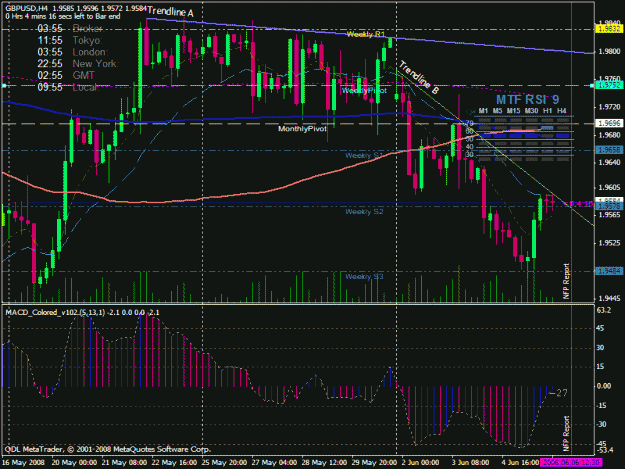
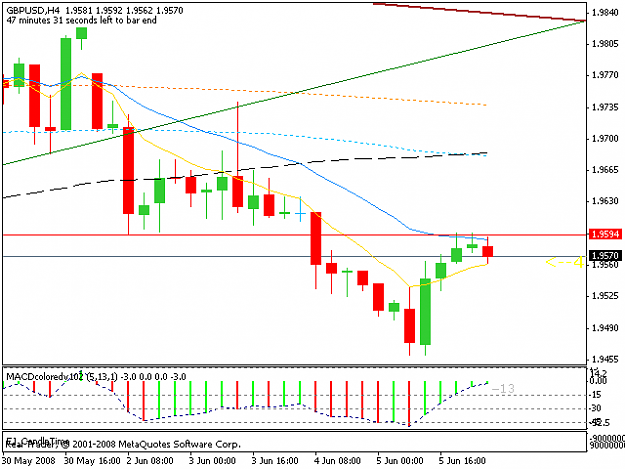
I think that this document is very importand and all of the newbie like me will have to take atention on it.It said a lot of information in brief for the hearth of the system so I upload it again.
Attached File
File Type: doc Market Rhythm 4 Hour Strategy.doc   36 KB | 1 download
 
 
  • Post #15,362
  • Quote
  • Jun 5, 2008 11:29am Jun 5, 2008 11:29am
  •  attictrader
  • | Joined Mar 2007 | Status: Member | 138 Posts
Hi Fena,

Others may correct me if I am wrong.....as I understand Philips MACD method, a counter trade would be taking a trade against the 89 MA, eg going long when price is below 89, going short when price is above 89......newbies are advised to steer clear of countertrades and only take TC trades.
Hope this helps...
 
 
  • Post #15,363
  • Quote
  • Jun 5, 2008 11:34am Jun 5, 2008 11:34am
  •  luckytiger
  • | Joined Oct 2007 | Status: It's all in the rhythm! | 26 Posts
Quoting fena74
Disliked
Hi all people here.Can anybody tell me what i sthat mean-I took it from Market Rhytm 4 Hrs Strategy-word file:
II.1 End of the UP Trend
..... When an up trend comes to an end the price is making lower highs and lower lows and the MACD sometimes shows divergence (meaning the price goes up while the MACD goes down).
.....
I know what is divergence mean with the price and MACD,but
I can not understand how the price could make LH and LL and the same time.I tried to imagine that but it is hard to understand that sentence.
Thank you in advance to all of you.
Ignored
I wrote that file and I know the sentence seems illogical at first. I thought a lot about that before I wrote it because I couldn't find the words to express it. It seems that I didn't find it.

I have attached the chart and wrote on it (I hope it is ok) maybe this way you will understand better what I meant. Listen again to the mp3 about market rhythm because Phillip explains better the inset 1.

I hope this will help you!
Attached Image (click to enlarge)
Click to Enlarge

Name: Rhythm Cycle.GIF
Size: 61 KB
 
 
  • Post #15,364
  • Quote
  • Jun 5, 2008 11:35am Jun 5, 2008 11:35am
  •  fena74
  • | Joined Nov 2007 | Status: Member | 76 Posts
Yes this helps-thank you and I will stay away from countertrend for now.Thank you AtticTrader
 
 
  • Post #15,365
  • Quote
  • Jun 5, 2008 11:38am Jun 5, 2008 11:38am
  •  fena74
  • | Joined Nov 2007 | Status: Member | 76 Posts
Luckytiger your file is perfect.I am new here from several months but I understood most of the file after deep reading so I am happy to have this info.Your file is perfect so it helps me a lot.Thank you.
 
 
  • Post #15,366
  • Quote
  • Jun 5, 2008 11:42am Jun 5, 2008 11:42am
  •  luckytiger
  • | Joined Oct 2007 | Status: It's all in the rhythm! | 26 Posts
Quoting fena74
Disliked
Thnak you and to you Yorik,Nice explanation.I know now that it is some kind of countertrand beginning so I will stay away from this for enter but it is very good sign to TP may be.Yes sometimes we need to repeat the material in this thread and it is very usefull.I like that way that thread works.Thank you.
Ignored
It is not a CT. I was reffering to the end of the trend. When the price comes below the 21EMA pulls back to it and may go to the 89SMA. Sometimes it doesn't go straight to the 89SMA and goes again above the 21EMA and then comes to the 89SMA. This is when it reaches lower highs.

A CT is when the price oly goes to the 8EMA or the 21EMA and then it continues the trend. This is how I see CT.
 
 
  • Post #15,367
  • Quote
  • Jun 5, 2008 11:47am Jun 5, 2008 11:47am
  •  luckytiger
  • | Joined Oct 2007 | Status: It's all in the rhythm! | 26 Posts
Quoting fena74
Disliked
Luckytiger your file is perfect.I am new here from several months but I understood most of the file after deep reading so I am happy to have this info.Your file is perfect so it helps me a lot.Thank you.
Ignored
I am also new to the strategy. This is why I wrote that file to understand better the rules and follow them. After you understand the startegy don't forget to do some backtesting. It will help you gain more confidence in the strategy.
 
 
  • Post #15,368
  • Quote
  • Jun 5, 2008 2:08pm Jun 5, 2008 2:08pm
  •  OldDog
  • | Joined May 2007 | Status: Member | 306 Posts
Quoting attictrader
Disliked
Hi Fena,

Others may correct me if I am wrong.....as I understand Philips MACD method, a counter trade would be taking a trade against the 89 MA, eg going long when price is below 89, going short when price is above 89......newbies are advised to steer clear of countertrades and only take TC trades.
Hope this helps...
Ignored
Hi attictrader, --You're correct that being below the 89 is one of the bearish signs. Being below the 89 and the 200 would mean that you would like to be able to take a short trade, though one might not be available at the time.

However, people often get confused about countertrend versus trend continuation trades in this method. Those terms refer to the MACD signals and not to the overall trend. Therefore, a TC means that the signal is in the same direction that the MACD shows regarding the zero line. When the MACD is above zero, a TC is a signal to go long, and a counter trend signal is a round top, a lower high, a double top, or any signal for a short.

When below the zero line, a TC is a signal to go short. Then, your counter trend signals are the ones to go long, round bottoms, higher lows, etc. The TC signals have shown themselves to be the more consistently reliable ones. --Tony
 
 
  • Post #15,369
  • Quote
  • Jun 5, 2008 2:31pm Jun 5, 2008 2:31pm
  •  attictrader
  • | Joined Mar 2007 | Status: Member | 138 Posts
Quote
Disliked
However, people often get confused about countertrend versus trend continuation trades in this method. Those terms refer to the MACD signals and not to the overall trend. Therefore, a TC means that the signal is in the same direction that the MACD shows regarding the zero line. When the MACD is above zero, a TC is a signal to go long, and a counter trend signal is a round top, a lower high, a double top, or any signal for a short.

When below the zero line, a TC is a signal to go short. Then, your counter trend signals are the ones to go long, round bottoms, higher lows, etc. The TC signals have shown themselves to be the more consistently reliable ones. --Tony
Old Dog,
Thanks for the clarification.....I now understand TC better (there were several TCs I didn't take because it meant going wrong way to the 89). So, looking forward to better trading in future.
AT
 
 
  • Post #15,370
  • Quote
  • Jun 5, 2008 3:54pm Jun 5, 2008 3:54pm
  •  Barak's pip
  • | Joined May 2008 | Status: www.locksmith24toronto.co m | 238 Posts
hi people, what's up?

did you see the round top on h1 tf? does it counts as a relyable pattern since it's on the h1 chart , or only if it were on the h4?

thanks
 
 
  • Post #15,371
  • Quote
  • Jun 5, 2008 3:55pm Jun 5, 2008 3:55pm
  •  fena74
  • | Joined Nov 2007 | Status: Member | 76 Posts
Sometimes we newbie need that information again to clarify out minds.These days I read so much from this thread that on first glance I understood everything and when I jump in the sea I see I can not swim That is because I need to simple the things and as Philip said-one step at a time.Thank you Old Dog for that info.It helps a lot.
 
 
  • Post #15,372
  • Quote
  • Jun 5, 2008 3:59pm Jun 5, 2008 3:59pm
  •  fena74
  • | Joined Nov 2007 | Status: Member | 76 Posts
Quoting Barak's pip
Disliked
hi people, what's up?

did you see the round top on h1 tf? does it counts as a relyable pattern since it's on the h1 chart , or only if it were on the h4?

thanks
Ignored
Hi Barack's pip,better stay away from 1 hour graphic and even forget that it is exists for now.And better forget for trading countertrand if you are new to this thread and system.After some time you will see that I am right.Ofcource that my advice is for you just if you are new to 4 Hour system and if it is-concentrate all of your attention just on 4 hour graphic and on TC only.Thanx.
 
 
  • Post #15,373
  • Quote
  • Jun 5, 2008 4:52pm Jun 5, 2008 4:52pm
  •  ira
  • | Joined Mar 2007 | Status: Member | 667 Posts
Here is a written copy of the last mp3.
Attached File
File Type: doc wrapup.doc   28 KB | 440 downloads
 
 
  • Post #15,374
  • Quote
  • Jun 5, 2008 11:57pm Jun 5, 2008 11:57pm
  •  Sukarno
  • | Joined Apr 2007 | Status: Member | 13 Posts
Hello everyone,

I think this would be interesting.
Will it be a trend continuation or will it break trendline B and retrace to the blue trendline A?

The MACD is touching the zero line and it's been a pin on the previous bar.

Keeping a close watch.

Gd luck trading! =)
Attached Image (click to enlarge)
Click to Enlarge

Name: gbpusd.gif
Size: 34 KB
 
 
  • Post #15,375
  • Quote
  • Jun 6, 2008 1:14am Jun 6, 2008 1:14am
  •  Seki
  • | Joined May 2008 | Status: Member | 161 Posts
Quoting ira
Disliked
Here is a written copy of the last mp3.
Ignored
Ira, thanks a lot!
 
 
  • Post #15,376
  • Quote
  • Edited at 2:09am Jun 6, 2008 1:16am | Edited at 2:09am
  •  poplar
  • | Joined Jun 2008 | Status: Member | 55 Posts
Quoting Sukarno
Disliked
Hello everyone,

I think this would be interesting.
Will it be a trend continuation or will it break trendline B and retrace to the blue trendline A?

The MACD is touching the zero line and it's been a pin on the previous bar.

Keeping a close watch.

Gd luck trading! =)
Ignored
in my chart it look much smother , if macd confirm tc i will take it with my SL in red line. what do u think? 47 minutes until close candle.

edit:
already closed no macd tc

http://forexfactory.com/attachment.p...1&d=1212729270
Attached Image (click to enlarge)
Click to Enlarge

Name: swiss.png
Size: 9 KB
 
 
  • Post #15,377
  • Quote
  • Jun 6, 2008 2:15am Jun 6, 2008 2:15am
  •  fxinvesta
  • | Joined May 2008 | Status: Member | 17 Posts
Hi, could anyone tell me what is the next high probability setup after TC, BOZ, and ZB? I have been learning for those 3 setups lately, and would like to go to the next level.
 
 
  • Post #15,378
  • Quote
  • Jun 6, 2008 2:29am Jun 6, 2008 2:29am
  •  ira
  • | Joined Mar 2007 | Status: Member | 667 Posts
I see no rhythm on the EUR, it's in range, so it can go to any direction, and with today's NFP it's a difficult one.
 
 
  • Post #15,379
  • Quote
  • Jun 6, 2008 2:33am Jun 6, 2008 2:33am
  •  ira
  • | Joined Mar 2007 | Status: Member | 667 Posts
Quoting fxinvesta
Disliked
Hi, could anyone tell me what is the next high probability setup after TC, BOZ, and ZB? I have been learning for those 3 setups lately, and would like to go to the next level.
Ignored

Hi, next level will be RT's and RB's from MA's or TL, or some strong support/resistance level. I like it very much when price rounds together with MACD, and there are tails piercing through MA or TL, or sup/res. They are very high probability trades and usually come with market rhythm rules.
 
 
  • Post #15,380
  • Quote
  • Jun 6, 2008 2:35am Jun 6, 2008 2:35am
  •  Yorik
  • | Joined Oct 2007 | Status: Member | 203 Posts
Hi, fxinvesta.
I'm also not so far from the beginning, so please consider the following as my IMHO, just the answer I would give myself if I had to answer the question you've posted.

So, you noted TC, BOZ and ZB as higher probability trades and that's generally accepted as those setups on MACD in most cases trigger trades in the direction of the trend. It should be noted though, that much depends on the rhythm (location and interaction of price to MAs) at specific setup, the "mode" of trend (if price is in a trend, in a range, or no rhythm and no range can be seen) and other signs. BOZ and ZB may be conter-trend (in the direction of EMA21); TC may be "against" strong price level which may make it less probable ans so on - I think you understand all that.

If really to make some gradation of setups according to their probability, then I would group named TC setups into "Class A" setups and then in "Class B" I would place:
a) round tops/bottoms when price established a channel (is in a range), taken from strong support/resistance and then, maybe
b) LH at the end of uptrend and HL at the end of a donwtrend.
Both subgroups of setups might be less probable than TCs and may trigger SL more often even before going in the needed direction.

As a conclusion, (my) short answer for your question would be: much depends on the specific setup but pro-trend setups are more probable than conter-trend ones I guess, you've known that when asking already...
 
 
  • Commercial Content
  • /
  • 4 Hour Strategy (MACD)
  • Reply to Thread
    • 1 767768Page 769770771 1578
    • 1 Page 769 1578
1 trader viewing now
  • More
Top of Page
Forex Factory Blog Updated: Alerting All Members
  • Facebook
  • Twitter
About FF
  • Mission
  • Products
  • User Guide
  • Media Kit
  • Blog
  • Contact
FF Products
  • Forums
  • Trades
  • Calendar
  • News
  • Market
  • Brokers
  • Trade Explorer
FF Website
  • Homepage
  • Search
  • Members
  • Report a Bug
Follow FF
  • Facebook
  • Twitter

FF Sister Sites:

  • Metals Mine
  • Energy EXCH
  • Crypto Craft

Forex Factory® is a brand of Fair Economy, Inc.

Terms of Service / ©2022