• Home
  • Forums
  • Trades
  • News
  • Calendar
  • Market
  • Brokers
  • Login
  • Join
  • User/Email: Password:
  • 6:35pm
Menu
  • Forums
  • Trades
  • News
  • Calendar
  • Market
  • Brokers
  • Login
  • Join
  • 6:35pm
Sister Sites
  • Metals Mine
  • Energy EXCH
  • Crypto Craft

Options

Bookmark Thread

First Page First Unread Last Page Last Post

Print Thread

Similar Threads

ECN && STP && Scalping && Hedging - Broker Review - Oct 2009 24 replies

Trading technical analysis system based on Igrok method 137 replies

Forex Ideas & Comments 18 replies

The IGROK files - Adventures of a rookie using the Igrok method 416 replies

Fibonacci thoughts & ideas.... 13 replies

  • Recycle Bin
  • /
  • Reply to Thread
  • Subscribe
  • 2,897
Attachments: Igrok Method. Q's & A's. Comments, thoughts and ideas
Exit Attachments
Tags: Igrok Method. Q's & A's. Comments, thoughts and ideas
Cancel

Igrok Method. Q's & A's. Comments, thoughts and ideas

  • Last Post
  •  
  • 1 5354Page 555657 489
  • 1 Page 55 489
  •  
  • Post #1,081
  • Quote
  • Apr 23, 2008 10:51am Apr 23, 2008 10:51am
  •  BentRod
  • | Joined Jan 2008 | Status: Member | 247 Posts
Igrok,
A question on trendlines.

One thing that annoys me is when I draw a trendline on a weekly chart it appears out(not accurate) when I go back to the daily chart.

I'm using Amibroker for my main charting(EOD data) but I even notice the same thing on Metatrader when going from say a 4 hour chart to a 15 min chart, the trendlines drawn on 4 hour will cross the price action on a 15 minute chart.

Do you get the same problem?
 
 
  • Post #1,082
  • Quote
  • Apr 23, 2008 3:08pm Apr 23, 2008 3:08pm
  •  Igrok
  • | Membership Revoked | Joined Dec 2006 | 2,771 Posts
Quoting BentRod
Disliked
Igrok,
A question on trendlines.

One thing that annoys me is when I draw a trendline on a weekly chart it appears out(not accurate) when I go back to the daily chart.

I'm using Amibroker for my main charting(EOD data) but I even notice the same thing on Metatrader when going from say a 4 hour chart to a 15 min chart, the trendlines drawn on 4 hour will cross the price action on a 15 minute chart.

Do you get the same problem?
Ignored
Yes. It's a well known problem. Sometimes those lines do not match on different time frames. Usually the most accurate ones are those drawn on the shortest time line. For example, yesterday's low on the USD/CHF at around parity was formed precisely on the hourly chart (exactly the third touch of the rising support which is a triangle's lower border) but it wasn't looking so accurate on dailies. Therefore it makes sense to make several different drawings and then place orders in accordance with the most accurate one but the stops must be placed according to the least accurate calculations.
 
 
  • Post #1,083
  • Quote
  • Apr 24, 2008 12:24am Apr 24, 2008 12:24am
  •  BentRod
  • | Joined Jan 2008 | Status: Member | 247 Posts
Quote
Disliked
Therefore it makes sense to make several different drawings and then place orders in accordance with the most accurate one but the stops must be placed according to the least accurate calculations.
Thanks mate.

See what you mean about USDCHF.
Hourly chart is precise whereas the low on my daily charts looks to be about 1.017 even though the data on that bar says the low was 1.002.
 
 
  • Post #1,084
  • Quote
  • Apr 28, 2008 6:40pm Apr 28, 2008 6:40pm
  •  ernesto
  • | Joined Oct 2007 | Status: Member | 242 Posts
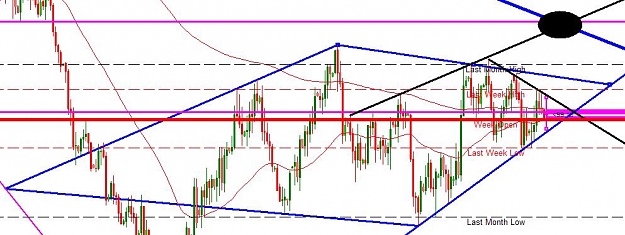
Taking a look at USDCAD we are still having the diamond - at least I would suggest it is one...

Current monthly range is 336 pips - avg 100 months is 448. Previous month was even 564 pips.

Current yearly range is 668 pips - avg 10 years is 1671. Previous year was even 2817 - i.e. we still have to go a long way to reach the yearly target.

According to those ranges the diamond might show us the future direction for the rest of the year. In addition it suggests that we might see high volatility in the next two days what is in line with the FOMC meeting on Wednesday.

UP - EVALUATION
------------------
The diagonal of the diamond is down - i.e. probability of up break out should be higher. What makes me "nervous" is the long time blue down trendline which I have marked with a black circle. Even though you don't use it - in addition 50 EMA might cross 200 EMA what I use as helping indicator regarding the mid-term trend.

DOWN - EVALUATION
----------------------
Long Term Trend is down - i.e. probability of continuation should be higher.

We also might see a false breakout of the diamond to the black cycle and afterwards a continuation of the downtrend.

Igrok - what do you think about this analysis. And... would you suggest any additional attributes I should include in my evaluation?
Attached Image (click to enlarge)
Click to Enlarge

Name: usdcad_20080429_RE.JPG
Size: 77 KB
 
 
  • Post #1,085
  • Quote
  • Apr 28, 2008 11:22pm Apr 28, 2008 11:22pm
  •  Igrok
  • | Membership Revoked | Joined Dec 2006 | 2,771 Posts
Quoting ernesto
Disliked
Taking a look at USDCAD we are still having the diamond - at least I would suggest it is one...

Current monthly range is 336 pips - avg 100 months is 448. Previous month was even 564 pips.

Current yearly range is 668 pips - avg 10 years is 1671. Previous year was even 2817 - i.e. we still have to go a long way to reach the yearly target.

According to those ranges the diamond might show us the future direction for the rest of the year. In addition it suggests that we might see high volatility in the next two days what is in line with the FOMC meeting on Wednesday.

UP - EVALUATION
------------------
The diagonal of the diamond is down - i.e. probability of up break out should be higher. What makes me "nervous" is the long time blue down trendline which I have marked with a black circle. Even though you don't use it - in addition 50 EMA might cross 200 EMA what I use as helping indicator regarding the mid-term trend.

DOWN - EVALUATION
----------------------
Long Term Trend is down - i.e. probability of continuation should be higher.

We also might see a false breakout of the diamond to the black cycle and afterwards a continuation of the downtrend.

Igrok - what do you think about this analysis. And... would you suggest any additional attributes I should include in my evaluation?
Ignored
1. False breaks on diamonds are very rare, but it hasn't beem completely formed yet.
2. Every trend comes to an end sooner or later and reverses eventually.
3. USD is oversold against some other majors like EUR and CHF. Minimal retracement to ease those monthly oversold conditions must be not less that 12 big figures. It should also make some posititve impact on the USD/CAD.
4. 1.11 level seems to me like a legit medium-term measured objective target on USD/CAD.
 
 
  • Post #1,086
  • Quote
  • Apr 29, 2008 12:17am Apr 29, 2008 12:17am
  •  Snuffleupagus
  • | Joined Mar 2005 | Status: Member | 143 Posts
Looks like a comb on usdcad daily.
 
 
  • Post #1,087
  • Quote
  • Apr 29, 2008 8:34am Apr 29, 2008 8:34am
  •  ernesto
  • | Joined Oct 2007 | Status: Member | 242 Posts
Quoting Igrok
Disliked
1. False breaks on diamonds are very rare, but it hasn't beem completely formed yet.
2. Every trend comes to an end sooner or later and reverses eventually.
3. USD is oversold against some other majors like EUR and CHF. Minimal retracement to ease those monthly oversold conditions must be not less that 12 big figures. It should also make some posititve impact on the USD/CAD.
4. 1.11 level seems to me like a legit medium-term measured objective target on USD/CAD.
Ignored
Thanks - regarding "it has not been completely formed yet" - do you mean we need a retest of 0.9950 area to make the diamond symmetrical? Having this retest the north-south-diagonal would be crossed by the east-west diagonal exactly in the middle...
 
 
  • Post #1,088
  • Quote
  • Apr 29, 2008 12:56pm Apr 29, 2008 12:56pm
  •  Igrok
  • | Membership Revoked | Joined Dec 2006 | 2,771 Posts
Quoting ernesto
Disliked
Thanks - regarding "it has not been completely formed yet" - do you mean we need a retest of 0.9950 area to make the diamond symmetrical? Having this retest the north-south-diagonal would be crossed by the east-west diagonal exactly in the middle...
Ignored
It would be nice to see it more symmetrical before a breakout takes place.
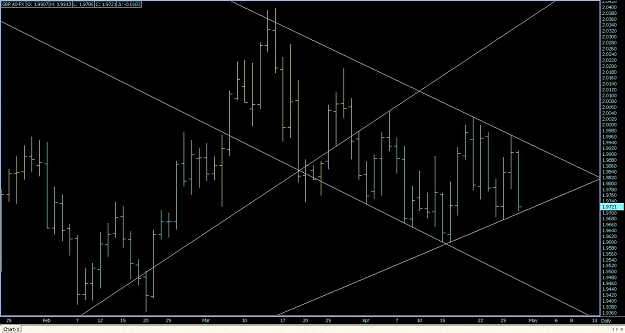
But for now another diamond on Cable looks quite promising.
Attached Image (click to enlarge)
Click to Enlarge

Name: Daily GBP A0-FX.jpg
Size: 105 KB
 
 
  • Post #1,089
  • Quote
  • Apr 29, 2008 1:47pm Apr 29, 2008 1:47pm
  •  ernesto
  • | Joined Oct 2007 | Status: Member | 242 Posts
Quoting Igrok
Disliked
It would be nice to see it more symmetrical before a breakout takes place.
But for now another diamond on Cable looks quite promising.
Ignored
Already thought about this one and posting it as well - but... considered it as no diamond because the break of the left upper boarder... do you consider this break not relevant?
 
 
  • Post #1,090
  • Quote
  • Apr 29, 2008 2:01pm Apr 29, 2008 2:01pm
  •  Igrok
  • | Membership Revoked | Joined Dec 2006 | 2,771 Posts
Quoting ernesto
Disliked
Already thought about this one and posting it as well - but... considered it as no diamond because the break of the left upper boarder... do you consider this break not relevant?
Ignored
It's not a break. The formation began forming AFTER that move and NOT BEFORE.
 
 
  • Post #1,091
  • Quote
  • Apr 30, 2008 4:27pm Apr 30, 2008 4:27pm
  •  ernesto
  • | Joined Oct 2007 | Status: Member | 242 Posts
Igrok - just curious whether you traded the GU breakout today? Personally went short @ breakout and set my stop to break even afterwards - unfortunately had no time to watch...

In this case according to your strategy you would have taken the long trade immediately after reversal and back-break of the diamond. Would you also suggest this as "automatic" trade or would you only take this trade if you are in front of the charts?

Just interested.... thanks for your advice....

And.... because of the false south-breakout of the diamond... are the probabilities now increased that the breakout will occur on the north side? That's what I would assume now...
 
 
  • Post #1,092
  • Quote
  • Edited 7:28pm May 2, 2008 7:15pm | Edited 7:28pm
  •  ernesto
  • | Joined Oct 2007 | Status: Member | 242 Posts
Igrok - I am currently trying to adapt some of your trading styles myself to trade on long-term basis. I am slowly figuring out that trading on lower level time frames is possible for a very very short term but very inconsistent and mainly goes against yourself.

Personally think that I have found a method that might be able to apply for my personality - also.... thanks to you and your insights.

Problem I have at the moment: I can't see any long term trending trade I would enter right now... probably because long term established trends at the moment might be in the mood of change (despite GBP in my opinion which from a technical point of few might continue its correction).

Trading very conservatively at the moment - do you think this might be the reason for not being able to enter any long-term trade at the moment? Thanks a lot for your ideas on that...

BTW... from all currency pairs I am watching USDCAD is the one being most probably and "reliably" changing to North....
 
 
  • Post #1,093
  • Quote
  • Edited 6:15pm May 3, 2008 5:58pm | Edited 6:15pm
  •  Igrok
  • | Membership Revoked | Joined Dec 2006 | 2,771 Posts
Quoting ernesto
Disliked
Igrok - just curious whether you traded the GU breakout today? Personally went short @ breakout and set my stop to break even afterwards - unfortunately had no time to watch...

In this case according to your strategy you would have taken the long trade immediately after reversal and back-break of the diamond. Would you also suggest this as "automatic" trade or would you only take this trade if you are in front of the charts?

Just interested.... thanks for your advice....

And.... because of the false south-breakout of the diamond... are the probabilities now increased that the breakout will occur on the north side? That's what I would assume now...
Ignored
No, I didn't trade on cable. First of all, I rarely trade on breakouts and usually prefer to project the pattern in advance in order to get a position earlier and to have more space for a maneuver in case somethign goes wrong. Also the pattern wasn't so obvious from the very beginning and I decided to skip on it. Besides the reliable stops in this case could be placed only above the upper right border of the pattern and that happened to be too much for my risk management technique.
 
 
  • Post #1,094
  • Quote
  • May 3, 2008 6:13pm May 3, 2008 6:13pm
  •  Igrok
  • | Membership Revoked | Joined Dec 2006 | 2,771 Posts
Quoting ernesto
Disliked
Igrok - I am currently trying to adapt some of your trading styles myself to trade on long-term basis. I am slowly figuring out that trading on lower level time frames is possible for a very very short term but very inconsistent and mainly goes against yourself.

Personally think that I have found a method that might be able to apply for my personality - also.... thanks to you and your insights.

Problem I have at the moment: I can't see any long term trending trade I would enter right now... probably because long term established trends at the moment might be in the mood of change (despite GBP in my opinion which from a technical point of few might continue its correction).

Trading very conservatively at the moment - do you think this might be the reason for not being able to enter any long-term trade at the moment? Thanks a lot for your ideas on that...

BTW... from all currency pairs I am watching USDCAD is the one being most probably and "reliably" changing to North....
Ignored
It is not so easy to get into a good longer-term trade either. Mostly because such opportunities are quite rare. Normally, the market provides only a couple of trading signals per year on any single currency pair in order to get engaged in such a trade targeing 1000+ pips moves. Getting reasonable stops for such a trade while the opportunity lasts only for a very short period of time is hard. But it's easy to miss such an opportunity because they have to be identified in advance and then carefully watched and precisely executed. It requires a lot of patience and a good knowledge of TA in order to chose the right strategy.
 
 
  • Post #1,095
  • Quote
  • May 5, 2008 6:17pm May 5, 2008 6:17pm
  •  ernesto
  • | Joined Oct 2007 | Status: Member | 242 Posts
Quoting Igrok
Disliked
It is not so easy to get into a good longer-term trade either. Mostly because such opportunities are quite rare. Normally, the market provides only a couple of trading signals per year on any single currency pair in order to get engaged in such a trade targeing 1000+ pips moves. Getting reasonable stops for such a trade while the opportunity lasts only for a very short period of time is hard. But it's easy to miss such an opportunity because they have to be identified in advance and then carefully watched and precisely executed. It requires a lot of patience and a good knowledge of TA in order to chose the right strategy.
Ignored
If you identify such a "perfect" setup (unfortunately we never know 100%)... do you increase the risk for the specific trade or do you trade exactly with the same risk as with every other trade? Reason for my question: it is very difficult to have your emotions under control if thinking you are at a major reversal.

If not risking more... would you increase your traded amount by using "buy @ dips" (in combination with moving stop loss to new resistance level near entry) or do you keep your risked amount static once entered ?
 
 
  • Post #1,096
  • Quote
  • May 8, 2008 12:47pm May 8, 2008 12:47pm
  •  Igrok
  • | Membership Revoked | Joined Dec 2006 | 2,771 Posts
Quoting ernesto
Disliked
If you identify such a "perfect" setup (unfortunately we never know 100%)... do you increase the risk for the specific trade or do you trade exactly with the same risk as with every other trade? Reason for my question: it is very difficult to have your emotions under control if thinking you are at a major reversal.

If not risking more... would you increase your traded amount by using "buy @ dips" (in combination with moving stop loss to new resistance level near entry) or do you keep your risked amount static once entered ?
Ignored
The position size mostly depends not on the "perfectness" of the setup, but rather on the reliability of the stops level and how far those stops have to be placed from the position entry point. The closer the stops - the bigger could be the actual trading contract. Because of that I first define the level for stops and only then start looking for an opportunity to make a trade, which greatly depends on the market itself. If it doesn't come to the stops level close enough I don't usually trade it at all.
 
 
  • Post #1,097
  • Quote
  • May 12, 2008 9:16pm May 12, 2008 9:16pm
  •  davelochen
  • | Joined May 2008 | Status: Member | 17 Posts
Hi Igrok,

I was wondering if you could help clarify some concepts in your book:

i) On page 96 you mention the use of "substitution" whereby you analyze one currency pair and use the results to trade another. Can elaborate or provide some examples on how to do this effectively (correlation?).

ii) On page 122/123 you mention that the main move of the day can be determined by the closing of the European session. This would indicate that about 2/3 of the 24 hour period would have elapsed before knowing the main move of the day. Would this (2/3 of time) be true for determining the main move of the week and month as well.

iii) During some days, the move the market makes on the intraday charts, seems like a complete V (or inverted) by the end of the European session. How does one determine the main move of the day in this case.


Thanks in advance.
 
 
  • Post #1,098
  • Quote
  • May 13, 2008 3:28am May 13, 2008 3:28am
  •  Igrok
  • | Membership Revoked | Joined Dec 2006 | 2,771 Posts
1. Substitute approach can be used in closely related pairs in order to get the better price levels. By chosing a pair with more obvious technical picture as a subject for initial TA and actually trading another one, which might provide a better or more obvious target level and some additional advantage can be achieved. In our market the closest relation is tradintionally between EUR and CHF that can often be substituted by one another. Also for this very purpose a USDX chart can be used in order to trade EUR.
2. Direction of the main move of the day can easily be detemined at any given moment. If to take a look at the charts starting from the beginning of the current trading day (no matter how large a current trading range is) the market first formed a top and then a bottom, then the main direction is down (and vise versa). For as long as the the average trading range is not formed yet the closer the market to the end of the day the lesser is the probability for the change in the direction of the main move, but even if it changes then a trade can be taken in the opposite direction in anticipation of the fully formed daily range.
3. Like I said, it doesn't matter how an intraday formation might look like. You can always determine the direction of the main move of the day by defining which extreme (top or bottom) has been formed first.


Quoting davelochen
Disliked
Hi Igrok,

I was wondering if you could help clarify some concepts in your book:

i) On page 96 you mention the use of "substitution" whereby you analyze one currency pair and use the results to trade another. Can elaborate or provide some examples on how to do this effectively (correlation?).

ii) On page 122/123 you mention that the main move of the day can be determined by the closing of the European session. This would indicate that about 2/3 of the 24 hour period would have elapsed before knowing the main move of the day. Would this (2/3 of time) be true for determining the main move of the week and month as well.

iii) During some days, the move the market makes on the intraday charts, seems like a complete V (or inverted) by the end of the European session. How does one determine the main move of the day in this case.


Thanks in advance.
Ignored
 
 
  • Post #1,099
  • Quote
  • May 13, 2008 5:29am May 13, 2008 5:29am
  •  davelochen
  • | Joined May 2008 | Status: Member | 17 Posts
Quoting Igrok
Disliked
1. Substitute approach can be used in closely related pairs in order to get the better price levels. By chosing a pair with more obvious technical picture as a subject for initial TA and actually trading another one, which might provide a better or more obvious target level and some additional advantage can be achieved. In our market the closest relation is tradintionally between EUR and CHF that can often be substituted by one another. Also for this very purpose a USDX chart can be used in order to trade EUR.

Yes, I can sometime see (or perhaps imagine) the similarity between the EUR and CHF in terms of the technical picture but cant really make use of the information in one chart, to trade the other. This is further complicated if I do a simple statistical correlation analysis (for the closing prices) which seems to indicate that EUR/USD and USD/CHF are negatively correlated by a significant amount and therefore move in opposite directions on daily, weekly and monthly basis. Thanks for letting me know about the relationship between USDX and EUR. Do USDX show a very similar technical picture to the EUR and therefore significant enough to trade the EUR base on the USDX technical picture.

2. Direction of the main move of the day can easily be detemined at any given moment. If to take a look at the charts starting from the beginning of the current trading day (no matter how large a current trading range is) the market first formed a top and then a bottom, then the main direction is down (and vise versa). For as long as the the average trading range is not formed yet the closer the market to the end of the day the lesser is the probability for the change in the direction of the main move, but even if it changes then a trade can be taken in the opposite direction in anticipation of the fully formed daily range.

Thanks for your reply.

3. Like I said, it doesn't matter how an intraday formation might look like. You can always determine the direction of the main move of the day by defining which extreme (top or bottom) has been formed first.

If during a typical trading day, I determine the main move of the day to be UP (bottom formed first, followed by top) but by the end of the day, the market has made a new bottom, which is lower than the first, how would I view the main move of this day if I were to look at it tomorrow to check the previous day's main move. Would I revise my direction to DOWN or would I still label it as UP even though it may be plain to see retrospectively, that a large move was made from top top to bottom.
Ignored
Thanks & Regards
 
 
  • Post #1,100
  • Quote
  • May 14, 2008 7:18pm May 14, 2008 7:18pm
  •  jotty
  • | Joined Jan 2006 | Status: Member | 196 Posts
Hi Igrok,

On the EUR/GBP daily chart, does it look like we are forming a diamond
 
 
  • Recycle Bin
  • /
  • Igrok Method. Q's & A's. Comments, thoughts and ideas
  • Reply to Thread
    • 1 5354Page 555657 489
    • 1 Page 55 489
1 trader viewing now
  • More
Top of Page
  • Facebook
  • Twitter
About FF
  • Mission
  • Products
  • User Guide
  • Media Kit
  • Blog
  • Contact
FF Products
  • Forums
  • Trades
  • Calendar
  • News
  • Market
  • Brokers
  • Trade Explorer
FF Website
  • Homepage
  • Search
  • Members
  • Report a Bug
Follow FF
  • Facebook
  • Twitter

FF Sister Sites:

  • Metals Mine
  • Energy EXCH
  • Crypto Craft

Forex Factory® is a brand of Fair Economy, Inc.

Terms of Service / ©2023