Intraday should look something like this since this is one continuos move, just keep pulling it until a low is established....shows the resell points if price attempts a rally.
I just going to wait this out myself, with the Fed announcing another possible cut tomorrow.
Ignored
You know what I find interesting is there's an 80% chance of a cut tomorrow (http://www.forexfactory.com/news.php?do=news&id=84116), and typically the markets already price in the news events before they happen right? Well what's up with the dollar rally today then? Shouldn't GBP bulls be taking over if there's going to be a cut? Or is the market pricing in no cut which could explain the bear move? IMO it looks like a no cut has been priced in. What'd you think Bo?
You know what I find interesting is there's an 80% chance of a cut tomorrow (http://www.forexfactory.com/news.php?do=news&id=84116), and typically the markets already price in the news events before they happen right? Well what's up with the dollar rally today then? Shouldn't GBP bulls be taking over if there's going to be a cut? Or is the market pricing in no cut which could explain the bear move? IMO it looks like a no cut has been priced in. What'd you think Bo?
Ignored
It may have alot to do with what they are expecting from the actual minutes of the meeting and what they are expecting to be said...a pause in cuts after this one and looking at Inflation now.
It may have alot to do with what they are expecting from the actual minutes of the meeting and what they are expecting to be said...a pause in cuts after this one and looking at Inflation now.
Ignored
Hmmm. OK. So the market is 2 steps ahead of me. LOL. Yeah you're probably right though b/c in that article they do mention after this cut, rates will remain the same. The minutes will dictate if they're doing this due to inflationary pressure or a growing economy going forward. If growing economy we can expect positive NFP report Friday. I guess time will tell us the story.
Hmmm. OK. So the market is 2 steps ahead of me. LOL. Yeah you're probably right though b/c in that article they do mention after this cut, rates will remain the same. The minutes will dictate if they're doing this due to inflationary pressure or a growing economy going forward. If growing economy we can expect positive NFP report Friday. I guess time will tell us the story.
Ignored
They will always be 2 steps ahead of us. Just go with the flow.
|
Joined Dec 2007
|
Status: Cash Rules Everything Around Me
|749 Posts
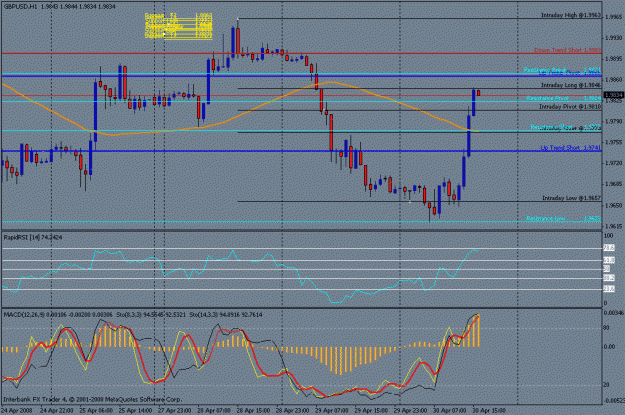
Please see chart below. This is in regards to moving intraday levels when price breaks out of the high/low and then returns. Do we leave the original swing or do we pull to the new low that has been created?
Would you use the first chart or the second chart - if you were making a trading decision? And also please explain why you'd prefer one over the other.
Personally, I'd choose the first chart posted b/c price was unable to meet its original target, so I'm thinking an open breaking intraday long levels could signal a move to the target at 2.00xx levels (although Stochs already OB and RSI starting turn).
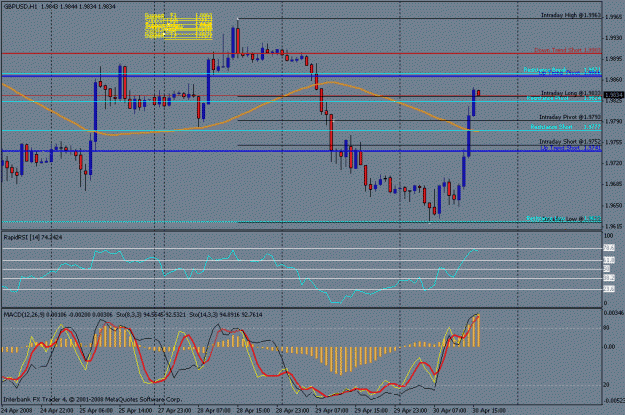
Ignored
Actually I'd prefer the 2nd chart since that was all one single move, switch the same chart to a 4 hour and youll see what I mean. Now is where you would place a support fib or swing on the movement that is going up now, you want to see if support holds now and confirm the direction is attempting to reverse back to long.
...FxChi, here's my take on where we are.....apologies for butting in, i'm trying to pick up on BO's style again....
We've been pulling the intraday fib down until today's lows, as it has been a continuous move, price hasn't tested the inner fib resistance levels until today, where we now see a resistance failure...so the bias is shifting to longs.
I'm waiting for price to reset itself though, to see if today's swing long can be supported at it's inner fibs....once FOMC is out of the way, we might have a clearer picture and something to set the next trade from.
Ignored
Exactly...now we are set up to trade once FOMC is out of the way and the dust settles.
...FxChi, here's my take on where we are.....apologies for butting in, i'm trying to pick up on BO's style again....
We've been pulling the intraday fib down until today's lows, as it has been a continuous move, price hasn't tested the inner fib resistance levels until today, where we now see a resistance failure...so the bias is shifting to longs.
I'm waiting for price to reset itself though, to see if today's swing long can be supported at it's inner fibs....once FOMC is out of the way, we might have a clearer picture and something to set the next trade from.
Ignored
Ahh yes you're correct. I'm still learning Bo's stuff. You renamed the fibs as a nice reminder. That's pretty neat. I'm used to the current levels, but definitely interesting to see how different traders adapt this to fit them.
I'm not even sure if I'll play FOMC. Will have to see a nice set-up. But I'm also thinking that it will take @ least 45 minutes before I trade. Which brings us to 3 EST. I'm thinking I may have a set-up but volatility may dry up and I'll be caught holding a position through Asian session. I'm leaning towards waiting until Euro later before making a trade.
I dont use a set number risk to reward ratio since the market actually detirmines the stop loss at the onset of a trade, In the example following (Mondays trade), Ill walk through it as an example of how much to risk. The 1st chart represents when you would have entered the market as price bounces from the Intraday levels and taking the safe entry of the first candle open above the Long level of 1.9820/1.9824 after the spread. With that as your entry you would look to the last support point as your stoploss point. Which in this case is 1.9774 after giving room for the spread below the last low point. Risking 50pips. Assume you start with an account balance of $1000 You only want to risk 2% of your balance or $1000 x .02= $20risk $20 from 50pips risked equates to .40 cents per pip...adjust your lot size to .40 cents per pip, which will be different for each trader as the leverage is different from account to account. Your target is 140pips away from your entry, but just as normal conditions are in the market it falls a few pips short of its target even if you do the norm of placing the target 5 pips below the target price.. The other chart examples show how to handle this in a safe manner and protect the trade from the stop being hit and still remain as close as possible to price and protect profits at the same time. Following price this way will eliminate you from deciding to exit manually and let your profits run as safely as possible...let the market take you out of the trade instead of you doing it manually just because price moves up and down the length of a candle and makes you antsy to exit. A set number for risk/reward just doesnt work for me just like a set number stoploss...the market detirmines this not a mathematical equation. In this trade as you look at the following charts only nets 65 pips from a possible 140 so a set number would have ended in disaster most likely even if you picked the direction right. The risk/reward on my opinion changes as each trade evolves. You can however calculate how much to risk on each trade....just stick to it. As soon as you change your amount to risk to a higher %...because you win a few in a row is the trade you will loose.
Ignored
Whats support made you hold your long besides the fact that pivot held....i saw a failure of support at the intrday long...i thought you would have close below that support since that seemed to me that is was holding major support...
I've got from some thread "BobokusFibo indicator" which shows yours daily fib range and also Daily Targets.
I don't know how they are calculated, but they work very good.
I've got idea to place pending orders in Daily Targets.
If target is long then place short, if short then long.
Here is how it looks today:
Ignored
Me personally i dont use it.I draw everything manually. The indicator draws them strictly from the high and low price of each day which isnt always correct.
Whats support made you hold your long besides the fact that pivot held....i saw a failure of support at the intrday long...i thought you would have close below that support since that seemed to me that is was holding major support...
Ignored
Support didnt fail unless the Short level of the Intraday failed it can bounce from any point above the short level. Sometimes it bounces from the Long level ,sometimes from the Pivot ,sometimes from the Short level. The 3 levels are a barrier between long and short. You dont base your trades from the fib levels but the price action or reaction to them.
Support didnt fail unless the Short level of the Intraday failed it can bounce from any point above the short level. Sometimes it bounces from the Long level ,sometimes from the Pivot ,sometimes from the Short level. The 3 levels are a barrier between long and short. You dont base your trades from the fib levels but the price action or reaction to them.
I couldn't agree with you more. I have been learning this since last summer. Most of the time I have found myself downloading this and that EA or Indicator understanding it was going to make me some money. I was into one here on the FF that has a lot of traffic. I noticed a lot of beginners like myself were looking for an easy system with out having to learn. I pulled myself out of this deadly trap. I want to learn to trade. Thanks for your dedication to share and teach Bobokus.
Maybe one day and I do mean this I can be in the position to help some one, because of my life experience I KNOW what it is like to be in need. Your a great American!!
Great call on the 62 envelope for trend direction identification only. Too many people try to use envelopes or MA's as a "trading system" and it leads to a blown account.
I hope more people (newbies) come to your thread to actually learn how to trade. Many, many sites/threads are based on some silly cross over or time of day trade or an EA that will make you millions. I'm here to tell ya, none of it works if you don't know how to trade, it takes the right info (provided here) and a lot of practice (for confidence) and you're golden.
Trading is pretty easy if you stay out of the noise/hype of some crazy ego driven idiots thread started for the mere purpose of "be'n the man"! There are a lot of good threads here at FF, but few teach you how to trade.
IMO your system should be knowing how to trade, your conformation for triggering a trade should come from a "trading system".
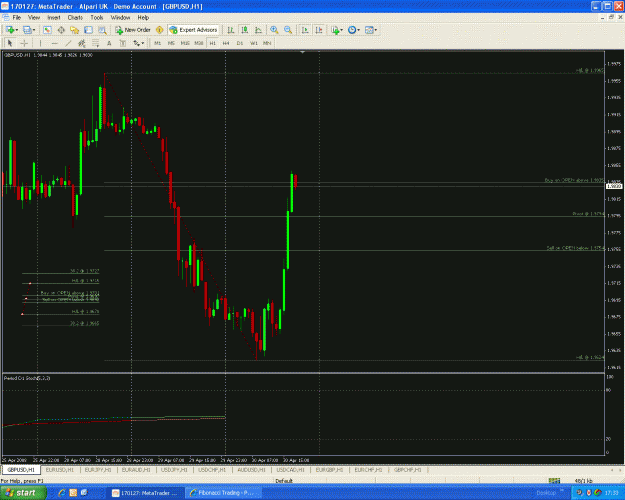
Bo, atm we're waiting to see if the latest intraday swing (yesterday's low - today's high) will be supported for a long entry on an open above it's 'buy fib'.
If price moves through the sell fib from here and an open prints below the sell fib level, would you enter a short there? or would you want an intermediate level of resistance to form first?
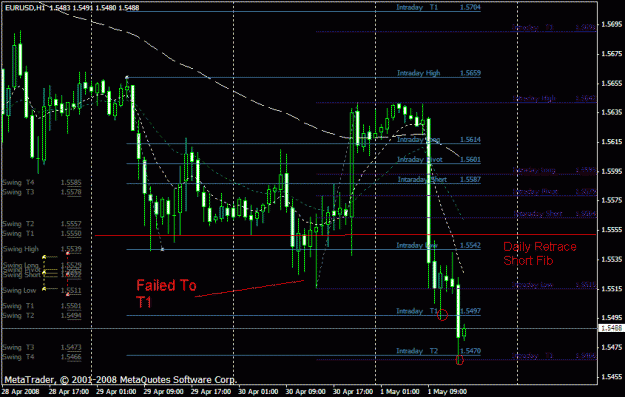
Yesterday I shorted the EUR on the break of the intraday low but it failed to reach its T1 and I was able to get out at BE after a few hours. After yesterday's rally I was thinking price was going to range and a low may be forming on the daily as the 5550 area is a short fib of the previous rertracement.
Today price fell a lot quickly - completed the blue intraday's T1. I am wondering how would your experience trade today's movement as I usually take my trades near the inner fibs but I want to start entering trades at the intraday hi/low because many times price does not do a bounce test after moving away from the inner fibs.
I guess I am asking at times when you need to enter trades at the intraday hi/lows what are some of your price action rules or guidelines.