OK, since we've just had a confirmed switch from an upleg to a downleg I thought now would be a good time to go through all the steps I take at such transition points.
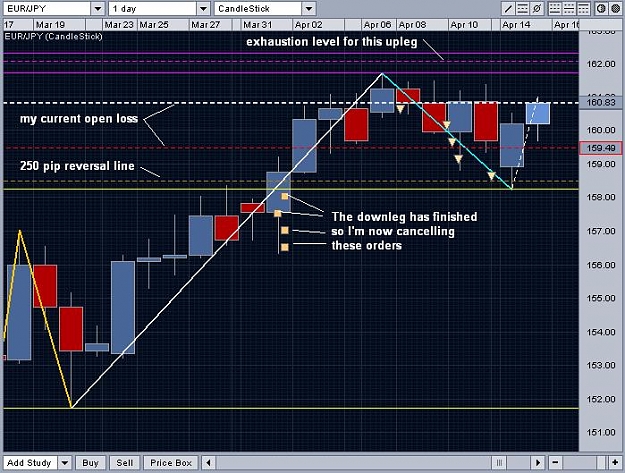
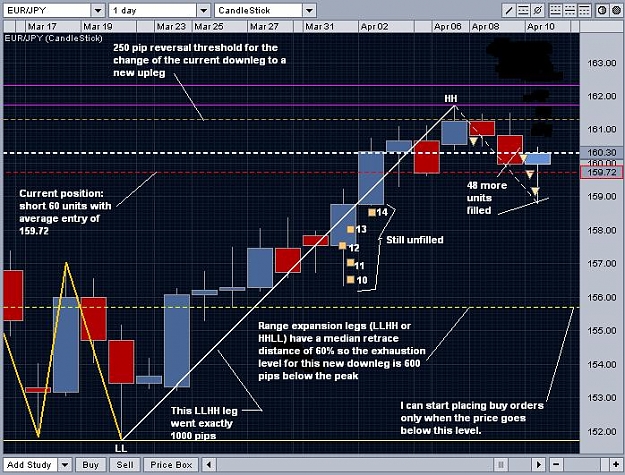
1. First of all, I use a 250 pip reversal threshold as a confirmation that one leg has ended and another has begun. This is just how a standard "zig-zag" indicator works, but Oanda doesn't have one so I have to keep track manually. That's the brown dotted line you always see on my charts. The price has now moved down more than 250 pips below its highest peak in the upleg, so we now have a downleg. Since we're now in a downleg, I have moved the brown reversal line to a point 250 pips above the lowest point in the downleg so I know when the downleg has ended.
4. The next step is to analyze the leg that has just ended and determine the exhaustion level for the current leg. There are only four kinds of price legs, and there is research on my site for each one describing the median move of the NEXT leg in the opposite direction. I refer to this median movement as the exhaustion level, because once price passes that level, there is less than a 50% chance that it will continue in that direction. The four types of legs and the median moves of the next leg are:
NOTE: THESE ARE FOR EUR/JPY ONLY. I DIDN'T LOOK AT ANY OTHERS.
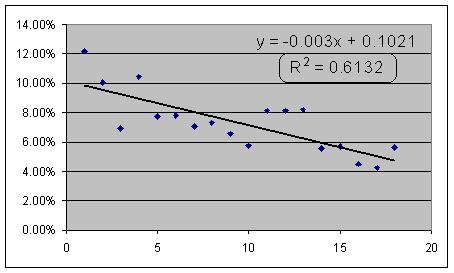
a. Trending legs (HLHH or LHLL): next leg reacts by 80%
b. Pullback legs (HHHL or LLLH): next leg reacts by 110%
c. Contraction legs (LHHL or HLLH): next leg reacts by 140%
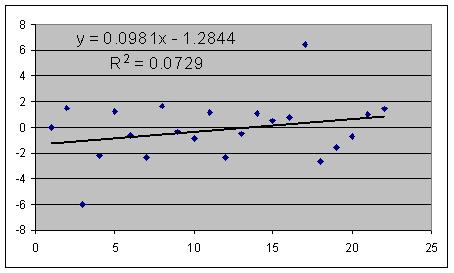
d. Expansion legs: (LLHH or HHLL): next leg reacts by 60%
The upleg that just ended went from 151.72 to 161.72, a move of exactly 1000 pips oddly enough. This upleg went from a lower low to a higher high, so it is a LLHH expansion leg. The median reaction is 60% So the exhaustion level of the current downleg is 600 pips below the last peak, or 155.72. That's the dashed yellow line on the chart. When we're in a downleg I make the line yellow like the regular support lines. For uplegs the exhaustion level is a weak form of "resistance" so I make it purple.
3. Now I wait for price to reach the exhaustion level. Let me point out a mistake in my previous (?) post where I said that as soon as this downleg started I would start to place buy orders above the price. Wrong. I changed that several posts back. I will only start placing the buy orders when the price has gone below the exhaustion level. If price reverses into an upleg before reaching the exhaustion level then I won't have any buy orders in at all behind this leg. Maybe the next one.
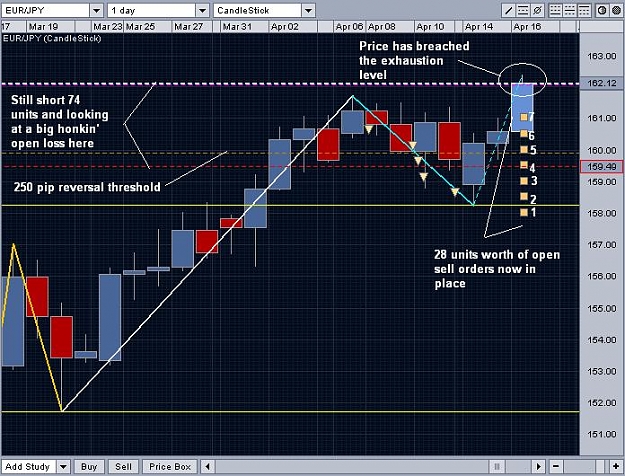
4. Finally I begin placing the orders in an increasing sequence. There are a few rules I have developed for how to do this.
a. I place them at round numbers 50 pips apart.
b. I start counting at the last peak or trough
c. Based on my current "unit size" my first order is 1 unit, then 2 and so on.
d. If price is on the profitable side of my entry, I "collapse" the orders on the other side into one large order in profitable territory.
e. If some of the orders get filled by a price spike (not large enough to create a reversal) then I will replace the furthest orders with a new order to fill the gap. We saw that happen a couple of times on this last upleg. This means I'm always moving sell orders higher or buy orders lower, which is what the strategy is all about.
So here's the current chart:
1. First of all, I use a 250 pip reversal threshold as a confirmation that one leg has ended and another has begun. This is just how a standard "zig-zag" indicator works, but Oanda doesn't have one so I have to keep track manually. That's the brown dotted line you always see on my charts. The price has now moved down more than 250 pips below its highest peak in the upleg, so we now have a downleg. Since we're now in a downleg, I have moved the brown reversal line to a point 250 pips above the lowest point in the downleg so I know when the downleg has ended.
4. The next step is to analyze the leg that has just ended and determine the exhaustion level for the current leg. There are only four kinds of price legs, and there is research on my site for each one describing the median move of the NEXT leg in the opposite direction. I refer to this median movement as the exhaustion level, because once price passes that level, there is less than a 50% chance that it will continue in that direction. The four types of legs and the median moves of the next leg are:
NOTE: THESE ARE FOR EUR/JPY ONLY. I DIDN'T LOOK AT ANY OTHERS.
a. Trending legs (HLHH or LHLL): next leg reacts by 80%
b. Pullback legs (HHHL or LLLH): next leg reacts by 110%
c. Contraction legs (LHHL or HLLH): next leg reacts by 140%
d. Expansion legs: (LLHH or HHLL): next leg reacts by 60%
The upleg that just ended went from 151.72 to 161.72, a move of exactly 1000 pips oddly enough. This upleg went from a lower low to a higher high, so it is a LLHH expansion leg. The median reaction is 60% So the exhaustion level of the current downleg is 600 pips below the last peak, or 155.72. That's the dashed yellow line on the chart. When we're in a downleg I make the line yellow like the regular support lines. For uplegs the exhaustion level is a weak form of "resistance" so I make it purple.
3. Now I wait for price to reach the exhaustion level. Let me point out a mistake in my previous (?) post where I said that as soon as this downleg started I would start to place buy orders above the price. Wrong. I changed that several posts back. I will only start placing the buy orders when the price has gone below the exhaustion level. If price reverses into an upleg before reaching the exhaustion level then I won't have any buy orders in at all behind this leg. Maybe the next one.
4. Finally I begin placing the orders in an increasing sequence. There are a few rules I have developed for how to do this.
a. I place them at round numbers 50 pips apart.
b. I start counting at the last peak or trough
c. Based on my current "unit size" my first order is 1 unit, then 2 and so on.
d. If price is on the profitable side of my entry, I "collapse" the orders on the other side into one large order in profitable territory.
e. If some of the orders get filled by a price spike (not large enough to create a reversal) then I will replace the furthest orders with a new order to fill the gap. We saw that happen a couple of times on this last upleg. This means I'm always moving sell orders higher or buy orders lower, which is what the strategy is all about.
So here's the current chart:
Attached Image (click to enlarge)