|
Joined Apr 2005
|
Status: Cruising The Outer Rim...
|2,175 Posts
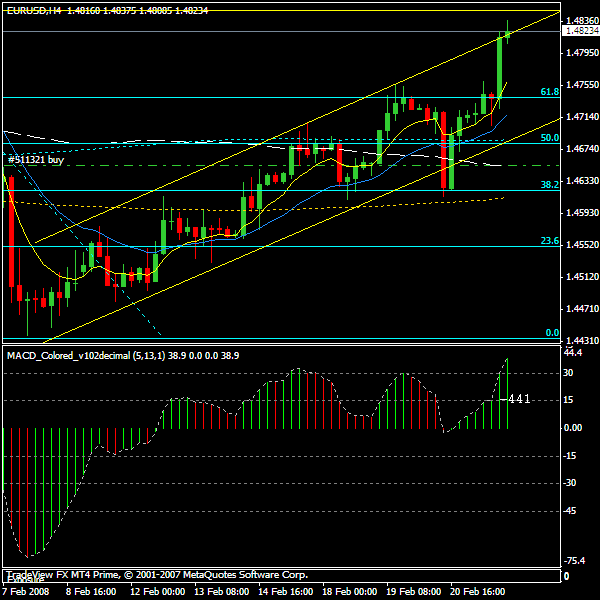
It's really interesting to see how price reacts to trendlines/support, etc. Price is forming a doji right at the upper part of the channel. I'm still in this trade, long from 4653. You'd expect to see some kind of pullback after this type of run. Price is quite a ways from the 8ema also so I'm thinking this pair will be taking a breather soon....
One more thing:
I'm going to put together some more 1 hour entry examples on the website. The only example on there now is the basic entry. As usual, I run all this by Phillip first to get his approval. I'll let everyone know when it has been added...
Take a look at how price reacted to the 365 here, the bold gold lines and the blue triangles. The 4 hour closed below the 21 and found support right at the 365 'area'....again.
Per the method: Price can come back to the 21 (up) before continuing in the new direction (down). Price was making its way back up to the 21, per the 1hr. The close of the long bull candle was my entry which was about an even R:R. I took one off at the 21 and still holding one.
It was a simple matter of price reacting to the 21 rules and the 365.
I will refrain from posting any more 1 hour entries.
Ignored
Pssst....Hey Palmer.......those 4sided thingys are Rectangles....the 3 sided thingys are triangles.......LOL .....Its amazing what we learn in Kindergarten....HeHe.....Pip Pip.......Jimdandy
How did you decide on your SL at 1.4680 on your E/U long trade earlier?
I struggled to define a SL based on anything solid so skipped the trade.
You also noted that we might see some zig zag over the moving averages until direction is found - how does your SL at the 21 and 200MA levels fit into your thinking on that one - wouldn't it have been in that potential danger zone?
I only trade the EUR & GBP now because before I was jumping around and was missing trades - those that are starting just stick to 2 pairs there really is no need for more.
Ignored
Hi Maxster,
New to this strategy. You say 2 pairs. What pairs do you normally watch?
Good luck with the tornadoes. I'm in South Florida (Fort Lauderdale) but we've had a lot of tornado warnings so far this year as well, which is strange for down here!
Joined Jul 2007
|
Status: Screw Long Term 5min For Life!
|1,259 Posts
Georgia here, Just lots of rain. Hope everyone traded well today, I have spent the past 15hours looking over price movement trying to get a little better
swissy looking good making a break I will look for a pull back to the 21ema or 89 with a TC on the MACD to get in. the swissy is now looking the good to the up side, see what comes of this.
very exprienced insight. From your past posts, you used Fib to filter bad 4h TC signals, and to enter order on better positions in 1 H, or to exit it. In your charts, you always have Intraday fibs and Swing fibs. How do you define their Highs and Lows? Did you use last swing in 4 H for intraday Fibs and previous day's High and Low for Swing fibs? It takes time to name two Fibs' levels, how do you do this so easy, by some indicator? Your practical guideline is very helpful. My understanding is to use Daily chart for direction , and to use fibs from 4 H last swing and 1 H previous day's swing to confirm Rhythm. Would you give some comments.
Thanks,
Jenny
Ignored
I don't use fibs to filter macd but to simply follow price movement. By following this movement I know the MACD is going to give a TC signal before it happens.
You need to think about fibs as a visible tool to see S/R levels better - not an indicator where price will turn.
In terms of the 4H - if you look at the last GBP down swing on the 4H then look at that same swing on the 1H you will clearly see trending movement (some call it impulse moves) and corrective movement. The key to understanding price movement is seeing/realizing price moves from one S/R level to another S/R - or from one corrective cycle to another corrective cycle with a trending cycle in between. Once you see this movement drawing the fib becomes very obvious - you draw it across the last trending or impluse swing.
You need to understand this movement to correctly draw the fib because the fib levels will simply act as a visual guide for S/R levels for the upcoming corrective cycle.
After studying tons of charts I notice that many times price will resume or ending the previous 1H corrective cycle when it bounces from the last minor 1H swing. If you think about it more it makes perfect sense as price is simply fulfilling Phillip's pullback to 21 then move away trending rhythm but on a still lower timeframe than the 1H.
Then once you put all the timeframes together - the picture becomes clear. But please don't concentrate your effort on finding entries & exits - but at first on seeing and fully understanding this price trending and corrective movement which is the secret. By looking at Phillip's rhythm this way you not only understand the rhythm but also price movement. Once you clearly know this movement finding entries and exits is the easiest part and you will find entries that suit your personality and trading style.
Also I don't look to the daily for direction in terms of that is the only direction I trade because I follow what price is doing on the 1H - I keep an eye on the daily in terms of S/R levels because price again moves from one S/R to another - hard to explain but just remember to follow price right now. For example before the EUR jumped this morning I was very cautious because price is very near a major S/R of 4720 - it could go either way. But now it has clearly broken that level price will most likely test the extreme of that corrective daily cycle. There are so many ways to trade once you understand what is going on.
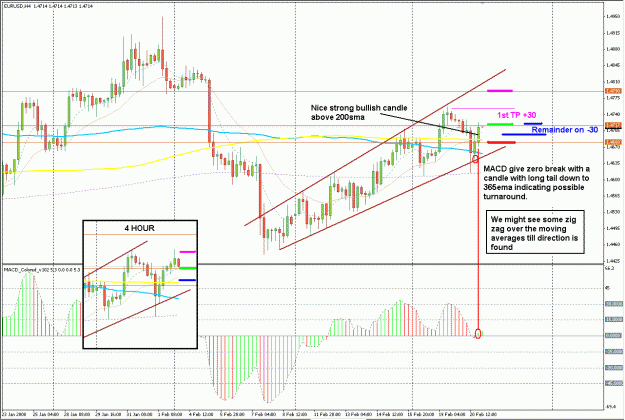
I was going over the daily wrap up on the EUR/USD. I posed a question yesterday, post 12038, as to whether I should stay in a trade... should i stay in after such a large candle. I got my 20 pips and decided to get out. Phillip, on the other hand stayed in because the candle was the 2nd of the wk going thru the 200MA and it was a strong candle. Needless to say, he made many more pips than myself. Next time it goes thru the 200 MA i won't be so quick to pull the trigger. Thanks for the lesson...it is the best way to learn.
Raymond
I don't use fibs to filter macd but to simply follow price movement. By following this movement I know the MACD is going to give a TC signal before it happens.
You need to think about fibs as a visible tool to see S/R levels better - not an indicator where price will turn.
In terms of the 4H - if you look at the last GBP down swing on the 4H then look at that same swing on the 1H you will clearly see trending movement (some call it impulse moves) and corrective movement. The key to understanding price movement is seeing/realizing price moves from one S/R level to another S/R - or from one corrective cycle to another corrective cycle with a trending cycle in between. Once you see this movement drawing the fib becomes very obvious - you draw it across the last trending or impluse swing.
You need to understand this movement to correctly draw the fib because the fib levels will simply act as a visual guide for S/R levels for the upcoming corrective cycle.
After studying tons of charts I notice that many times price will resume or ending the previous 1H corrective cycle when it bounces from the last minor 1H swing. If you think about it more it makes perfect sense as price is simply fulfilling Phillip's pullback to 21 then move away trending rhythm but on a still lower timeframe than the 1H.
Then once you put all the timeframes together - the picture becomes clear. But please don't concentrate your effort on finding entries & exits - but at first on seeing and fully understanding this price trending and corrective movement which is the secret. By looking at Phillip's rhythm this way you not only understand the rhythm but also price movement. Once you clearly know this movement finding entries and exits is the easiest part and you will find entries that suit your personality and trading style.
Also I don't look to the daily for direction in terms of that is the only direction I trade because I follow what price is doing on the 1H - I keep an eye on the daily in terms of S/R levels because price again moves from one S/R to another - hard to explain but just remember to follow price right now. For example before the EUR jumped this morning I was very cautious because price is very near a major S/R of 4720 - it could go either way. But now it has clearly broken that level price will most likely test the extreme of that corrective daily cycle. There are so many ways to trade once you understand what is going on.
Ignored
maxster,
I think that what you said above is the essentials of the market. Thanks for the excellent observation.
Now I have a request: can you give an example about the S/R drawings, price move cycle, rhythm related with D1,H4,H1 together? If you can also give some snapshots, that is perfect.
I hope that I can understand and master your method easier. Thank you very much. Look forward to your detailed introduction about the market movement.
Thanks Maxster for your knowledge in price movement cycle. I should study it now. Can I find this topic in forums or somewhere? Hope you give more examples for upcoming trade in term of price movement cycle.
maxster,
I think that what you said above is the essentials of the market. Thanks for the excellent observation.
Now I have a request: can you give an example about the S/R drawings, price move cycle, rhythm related with D1,H4,H1 together? If you can also give some snapshots, that is perfect.
I hope that I can understand and master your method easier. Thank you very much. Look forward to your detailed introduction about the market movement.
Ignored
I too believe what I am describing is the core fundamental or foundation of price movement.
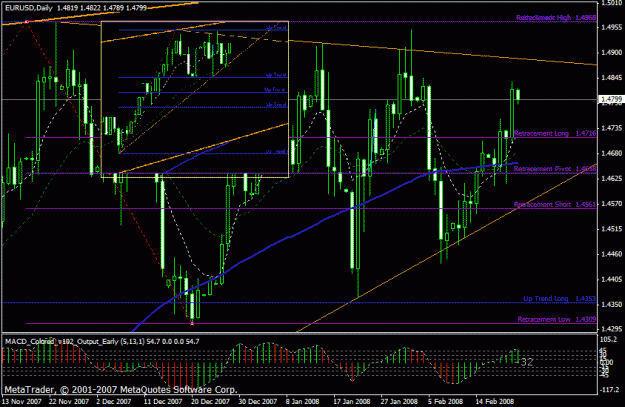
Let's look at the EUR right now. On the daily chart you can clearly see it is in corrective movement. That daily corrective movement is a result of price moving up from a previous S/R level - you can see the trending movement on the inset weekly chart - notice how price bounced from the 32% on the inset multiple times. On the daily chart I also have a fib across the first down swing - those S/R levels play a major part on our beloved lower timeframe 4H movements. I do not draw this pullback fib on the 1H corrective swing because I do not go lower than 1H. Look at the 4H chart and see how those fib levels give price a very tough time. Now look at the extremes of the corrective daily cycle and what has price done. You should see a clearer picture of the 4H price movement because you are aware what the higher timeframe is doing.
Now this same cycle of weekly/daily - plays out on the 4H/1H. Right now price has clearly broken the Daily 4720 fib level and we are all anticipating a TC. Most are also aware of the daily extreme 4900 level.
We already know that the weekly trend is up and the daily is in a corrective cycle of that weekly trend. Price may make an attempt to break and resume the weekly trend. Or get rejected again and head back into the extreme low of the daily cycle. We don't know what price will do just that it will have some tough times ahead and we can only follow it. I follow it with the 4H/1H while watching the daily as price goes to/from/away the daily S/R levels.
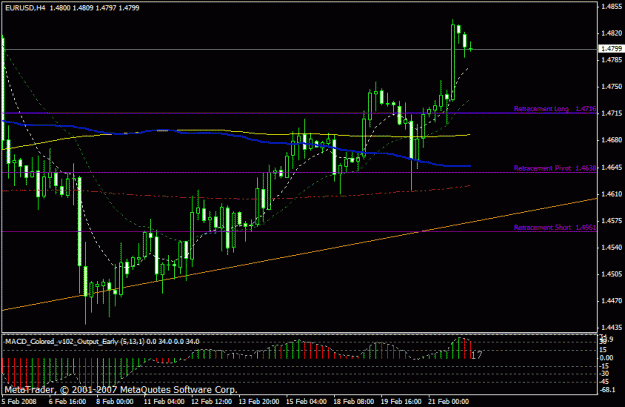
So the 1H currently is in a corrective cycle of the previous up move - keeping in mind that the 32% is the 8EMA and 62% is the 21EMA to see how this fits into the Phillip's rhythm. I will wait for price to enter below the 32% level - then if a 1H bar closes above it, I begin following the last minor swing to look for entry - basically entering if price bounces perfectly from that minor swing's fib levels. You will find if price retraces pass the 62% of that minor swing the 1H corrective cycle is not over yet and I will wait for another bounce from the 1H fib levels. If a 1H bar closes below the 62% level of 4750 - I will no longer be looking for longs. If you understand what is happening you can start to take counter-trend trades when 4750 is broken - much like my post yesterday on the GBP where I would no longer be looking for shorts after 9450 was broken. But I have elected to do trending trades only by taking the middle 1/3 of a 4H move.
Rhythm is the way price moves, or dances, around the MA's (bursts into song... rhythm is a dancer...). Look at the current GBP/USD chart; price crashes through the 200 sma on the 31st Jan, but, mindful of the rules, goes back to the 200 (rather as a young girl at a dance would go back to an elderly lady and her mother, just to be polite, before rushing off in the direction she was headed, arm-in-arm with the 8 ema). In this case, price goes back to the 200 and the 21 before continuing in a -2 bear rhythm until around the 7th Feb. This is rhythm.
Where the MA's get tangled up together and price straddles them, going first in one direction then the other, this is where there is no rhythm.
Market motion is the activity involved in creating price movement. Large candles create large pip movements and fast motion. Look at the candles just before the 31st Jan drop. The bear (red) candles are larger than the bull candles, showing more activity. The rhythm is still +2 bull rhythm, but the motion is not really upward any more.
The market motion now begins to show some emotion (still with me?). There are lots of tails down to the 21 in the period leading up to the drop on the 31st Jan. This would usually indicate that price wants to carry on pushing up. But there is resistance to the desire to go up, you get a couple of spinners off the 8ema, and price plummets. This is the emotion showing in the candlesticks.
.... so, the emotion of the dancers (traders) shows in their candlestick formations and leads the motion (speed and direction) of the dance. The dance (price action in bull / bear market) has certain steps or rules that prevents it turning into chaos, these rules create the rhythm that you see on the charts.
Basically, it doesn't matter so much what you call it, so long as you always do a proper analysis showing direction and speed of price, type of candlestick formations now occurring, and position of the MA's relative to each other and to price. Do this before you decide whether to go long or short and whether to trade at all.
...
Rebecca,x.
Ignored
wonderful post!! I was traveling few days and when I came back I found your post. Really good interpretation. Thanks.
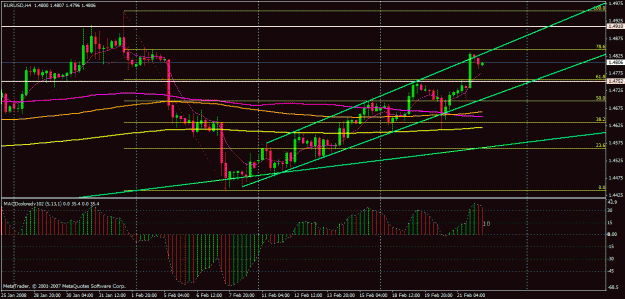
Check out how fibs have been used as S/R on the Euro.
I sometimes set TPs a few pips before strong fib lines. Today I set my first TP a few pips below the .618 Fib, and set the second TP at my upper TL.