Hi Chris,
i get your 1 hr and daily charts entries and exits .. i get your exits on the 5 min chart but i dont get the entries on 5 min .. can you please explain more ? also what is the red dot on your chart ?? the last one that u have in the asian session ...
The Ventex program will not be used by this method.
A new program has been written to use the same method and it will be released later (ignore the title of this post).
Hi Chris,
i get your 1 hr and daily charts entries and exits .. i get your exits on the 5 min chart but i dont get the entries on 5 min .. can you please explain more ? also what is the red dot on your chart ?? the last one that u have in the asian session ...
Thanks,
Goodbadmas
Ignored
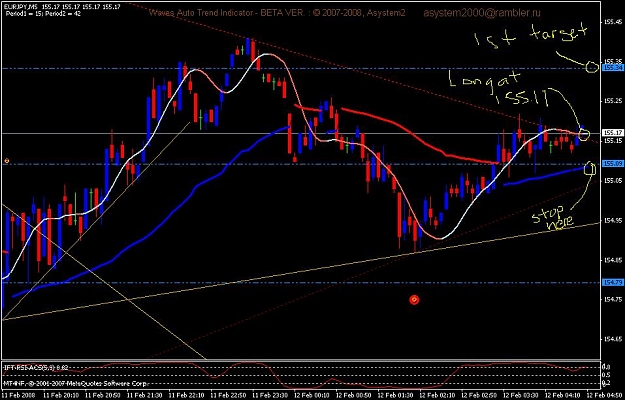
Happy to answer! As you see the ventex is blue signaling long trades...that long trade was taken with the slope indicator as the trigger for the long trade..the stop is at the ventex level and first target the autofib level..you can also take first profit at the slope direction change..hope this helps.
In the first post, can you include the links for your post with all the attachments? That will make it easier for new visitors (or you can just tell the post number where the attachments can be found). You can also include a link to my post where I explain V-Entex. I will add the details for the IFT-RSI later.
It uses two moving averages (one made up by bar Highs and other made by bar Lows). The plot shows only one of the two, depending on which side the price is. These lines are considered as Support or Resistance.
The V referes to Variable. The period (number of bars) is flexible. Unlike fixed bar moving averages, this program uses the ATR of recent bars to change the speed of these two MAs. In slow market it uses the given period of MAs and in fast markets it reduces the number of bars to make a quicker respsonse to price changes. The flexibility can be controlled by PipStep Input. (TimeFrame=0 will use current chart TF and -1 will use next higher TF.)
These are the details of the V-Entex. But one can use it without bothering about the details too much.
With Regards,
chandra
Ignored
Hi Chandra,
Thanks because I'm not smart enough to explain it as brilliantly as you did. Thanks my friend!
In the first post, can you include the links for your post with all the attachments? That will make it easier for new visitors (or you can just tell the post number where the attachments can be found). You can also include a link to my post where I explain V-Entex. I will add the details for the IFT-RSI later.
Regards,
chandra
Ignored
Hi Chandra,
I will do just that! Thanks for your help!
Happy to answer! As you see the ventex is blue signaling long trades...that long trade was taken with the slope indicator as the trigger for the long trade..the stop is at the ventex level and first target the autofib level..you can also take first profit at the slope direction change..hope this helps.
Ignored
Thanks Chris,
now its making a lot of sense to me ... now i see the beauty of this system looks great ..
Happy to answer! As you see the ventex is blue signaling long trades...that long trade was taken with the slope indicator as the trigger for the long trade..the stop is at the ventex level and first target the autofib level..you can also take first profit at the slope direction change..hope this helps.
Ignored
Hi Chris,
Based on this why was the entry not at 155.37 (or around that) on first chart?
Hi Bk, What chart you talking about so i'm not confusing myself..lol. I am sure I have good or at least some good reason for it...just kidding...please reference what chart and i will be explain.
Hi Bk, What chart you talking about so i'm not confusing myself..lol. I am sure I have good or at least some good reason for it...just kidding...please reference what chart and i will be explain.
To everyone,
I was a new trader like many of you..or your a seasoned one watching this thread my goal and my desire is to make everyone profitable trades..my goal is to make a system work..or all together find a system together that makes us all flithy rich...if anyone is opposed to that well..not sure how much i can help than...
thanks bk! I see what your talking about..the reason the trade is not made is that is not in agreement with the ventex...yes that trade would have been profitable..but that trade could have wound up and bit u bad without trading philosophy based on discipline...the ventex makes u take trades in a trend direction and it makes you be disciplined...i hope this helps..and sorry if this not a good explanation...
thanks bk! I see what your talking about..the reason the trade is not made is that is not in agreement with the ventex...yes that trade would have been profitable..but that trade could have wound up and bit u bad without trading philosophy based on discipline...the ventex makes u take trades in a trend direction and it makes you be disciplined...i hope this helps..and sorry if this not a good explanation...
Best to you BK,
Chris
Ignored
Thanks but i am still confused. :-)
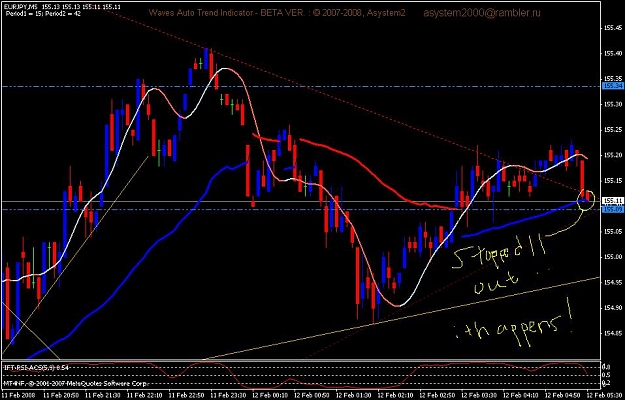
First the slope turned.
Then ventex was red few pips below.
But we waited till 155.19. Just trying to figure out how this figure came?
Is it because of the next candle below blue ventex of past?
Thanks but i am still confused. :-)
First the slope turned.
Then ventex was red few pips below.
But we waited till 155.19. Just trying to figure out how this figure came?
Is it because of the next candle below blue ventex of past?
Thanks a lot of quick replies.
BK
Ignored
It's okay BK...good questions...i was away from the computer during this time after the short trade..but i will watch when this happens and come up with a rule for it...but at first glance i am going to wait for clear direction before placing a trade again...price was ranging alot at that time..soo maybe we need to add a indicator that helps us weed out those times..maybe ADX or Bollinger Bands...thanks for the questions BK they are good ones!!
Down the road here I would like to get a chat-room on skype or someplace else based on this trading method or it's modified version...i will give this method a few weeks to get going and than open up a room..all interested please let me know..Thanks in advance!