Ok .... here goes
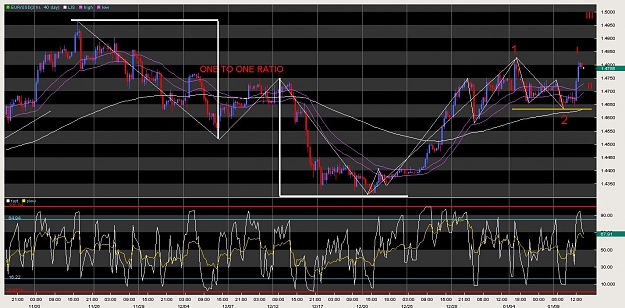
EURUSD Chart
First 3 wave sare classified as A or 1 ; B or 2 then C or 3
-if 2nd point exceeds origin of first point, then we rule out wave 1 and 2 as wave 2 never goes beyond origin of wave 1
-if 3rd point exceeds 1.618 of A, then we rule out wave C
Looking at the chart again and checking the price legs, we see 3rd point exceeding 1.618 of A.
Therefore, to me price is in a a set of impulsive waves 12345 and currently developing a wave 4.
Now why wave 4 still...
wave 4 is related to overall time it takes from w0 to w3 and is normaly expanding correctively sideways. Could be 23.6% retrace if trend very strong
or normally 38.2 - 50% normally
but can be till 61.8%
if more than 61.8% retracement of wave 3 occurrs, a failed 5th or truncated 5th follows
So first , time wise I think it is still in a 4th. so no failed 5th yet to my mind.
Structurally, looks more like it is making an expanded corrective FLAT which more likely will have a wave C = 1.618 of A. note ticked levels
Another thing about the failed 5th possibility is that, if we look at the internal structure of that leg, it does not look like a 5 wave impulse but a 3 wave structed wave. so it must be a wave B.
Hoping I covered the whole ground to narrow down probability of identifying the waves here.
ooopppps. more to add:
if price is in a wave 4 of a wave 3 , then it should be followed by a wave 5 of same degree. w1 of 3 looks extended and is longer than w3 of 3. so wave 5 of 3 must be shorter than wave 3 of 3.
this should then be followed by a retracement of the wave 3 to get the wave 4. ( It would look like 2nd guessing the markets to some ) However, since we have the rules of EWT, why not try to apply them with its full might and force it at least gives you a probable scenario. ( it can still have turn out differently. but at least you have 1 scene where you have an ideal scenario based on applying the EW rules.
EG
EURUSD Chart
First 3 wave sare classified as A or 1 ; B or 2 then C or 3
-if 2nd point exceeds origin of first point, then we rule out wave 1 and 2 as wave 2 never goes beyond origin of wave 1
-if 3rd point exceeds 1.618 of A, then we rule out wave C
Looking at the chart again and checking the price legs, we see 3rd point exceeding 1.618 of A.
Therefore, to me price is in a a set of impulsive waves 12345 and currently developing a wave 4.
Now why wave 4 still...
wave 4 is related to overall time it takes from w0 to w3 and is normaly expanding correctively sideways. Could be 23.6% retrace if trend very strong
or normally 38.2 - 50% normally
but can be till 61.8%
if more than 61.8% retracement of wave 3 occurrs, a failed 5th or truncated 5th follows
So first , time wise I think it is still in a 4th. so no failed 5th yet to my mind.
Structurally, looks more like it is making an expanded corrective FLAT which more likely will have a wave C = 1.618 of A. note ticked levels
Another thing about the failed 5th possibility is that, if we look at the internal structure of that leg, it does not look like a 5 wave impulse but a 3 wave structed wave. so it must be a wave B.
Hoping I covered the whole ground to narrow down probability of identifying the waves here.
ooopppps. more to add:
if price is in a wave 4 of a wave 3 , then it should be followed by a wave 5 of same degree. w1 of 3 looks extended and is longer than w3 of 3. so wave 5 of 3 must be shorter than wave 3 of 3.
this should then be followed by a retracement of the wave 3 to get the wave 4. ( It would look like 2nd guessing the markets to some ) However, since we have the rules of EWT, why not try to apply them with its full might and force
EG
Attached Image (click to enlarge)