http://i13.tinypic.com/73cgayd.gif
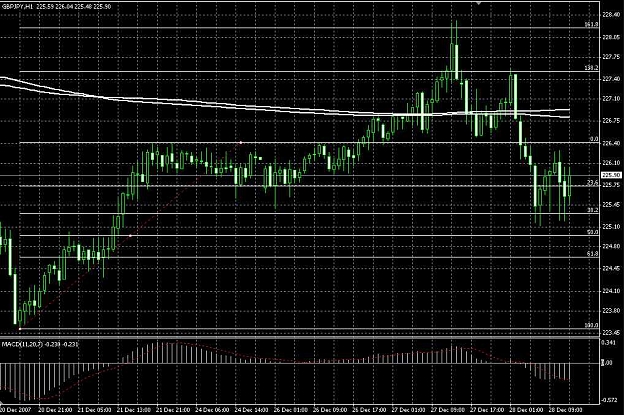
PRICE ACTION...
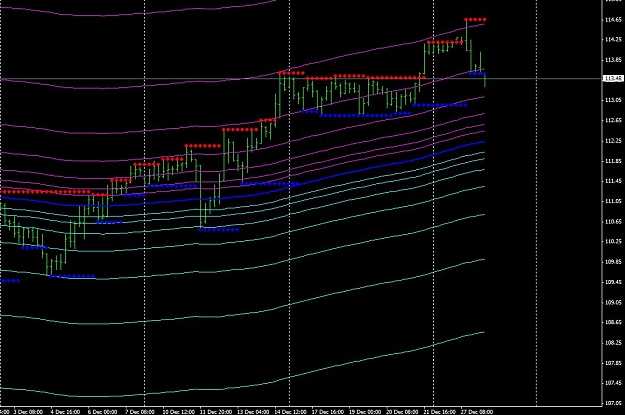
Once again on the H4 the USDJPY reached the fib projections (salmon dots).
It's almost a "Skunny textbook" example over the past day and a half:
Price reversed off support (blue dots) and reached the upper .618 fib projection (salmon dots), then price reversed to first test support and then penetrate support and reach the lower .618 fib projection.
Price has surpassed the .618 fib projection as of this post. I would venture a guess it will test the previous support 112.79.
Looks like Skunny likes my charts. Since it is his thread, I guess he has final say. 
PRICE ACTION...
Once again on the H4 the USDJPY reached the fib projections (salmon dots).
It's almost a "Skunny textbook" example over the past day and a half:
Price reversed off support (blue dots) and reached the upper .618 fib projection (salmon dots), then price reversed to first test support and then penetrate support and reach the lower .618 fib projection.
Price has surpassed the .618 fib projection as of this post. I would venture a guess it will test the previous support 112.79.
DislikedSbrickman, cool charts, keep up the good work. That "moley quail" is getting closerIgnored