• Home
  • Forums
  • Trades
  • News
  • Calendar
  • Market
  • Brokers
  • Login
  • Join
  • User/Email: Password:
  • 6:57am
Menu
  • Forums
  • Trades
  • News
  • Calendar
  • Market
  • Brokers
  • Login
  • Join
  • 6:57am
Sister Sites
  • Metals Mine
  • Energy EXCH
  • Crypto Craft

Options

Bookmark Thread

First Page First Unread Last Page Last Post

Print Thread

Similar Threads

Your own HOLY Grail (and how you know you've found it) 19 replies

Developing the "Holy Grail" Trading System 4 replies

I may have found the Holy grail 75 replies

I think I found a holy grail. 17 replies

  • Rookie Talk
  • /
  • Reply to Thread
  • Subscribe
  • 49
Attachments: The Holy Grail - Found
Exit Attachments

The Holy Grail - Found

  • Last Post
  •  
  • 1 89Page 101112 46
  • 1 9Page 1011 46
  •  
  • Post #181
  • Quote
  • Dec 11, 2007 7:26pm Dec 11, 2007 7:26pm
  •  Skunny
  • | Commercial Member | Joined Jan 2007 | 690 Posts
Quoting JFX81
Disliked
Well, I would like to know more, but mainly I am wondering how large the stops are so as not to get stopped out by "noise" in the markets. If his stops are huge then a high winning percent is no big deal because it only takes getting stopped out a few times to wreck the account.
Ignored
I hear ya there. But, I'm sure that isn't the case. In this case of +90% you would need a ridiculous stop and only grab a farmers dozen of pips to make it fail. I'm guessing John isn't a buffoon. If you are only after a few pips and have a huge stop you might be in a 10 pip trade for a week....lol.
Robonacci com
 
 
  • Post #182
  • Quote
  • Dec 11, 2007 9:36pm Dec 11, 2007 9:36pm
  •  hanover
  • Joined Sep 2006 | Status: ... | 8,089 Posts
I've been trying to give all of this some thought. I wish I understood more about the underlying forces that drive the market, then perhaps I'd have a chance of figuring out either JohnW's or Skunny's method.

I should point out that what follows is just my ignorant schoolboy guesswork, but I'm hoping it might stimulate ideas amongst more knowledgeable people, who are then willing to share for the benefit of us all. The comments refer to the GBPJPY,M15 chart attached below.

Let's assume that we are somehow able to determine a probable reversal (swing) point. We know that many retail traders place their stops just outside the swing point. So if price, after making a "decent" move, was to create a swing point ("A" in the diagram below), then reverse somewhat to point "B", then return to a point at or just beyond the swing point ("C"), before taking off strongly toward "D", the move from "B" to "C" could represent the taking out of stoploss orders by the "smart money", providing them with both liquidity and a superior entry price, to ride the move from "C" onward. When I was trading equity CFDs, I remember reading about A-B-C patterns that occasionally occur at the end of trends. In technical terms, "B" is also likely to form the second Demark demand point prior to a possible trend line break (green line). "A" and "C" form something akin to a double top, which I understand is a widely recognized reversal – if we summarize A-B-C into two candles, we have something like a James16 DBLHC (although the chart shown is not perfect: "A" and "C" should be ideally be much closer to each other).

Perhaps the speed/momentum at which price is moving between "B" and "C", and/or then away from "C" might give a further clue as to whether this is likely to result in a decent reversal. Swift moves will generate longer-than-normal candles. Heavyweight players might encounter slippage which would result in their having to scale into positions, driving prices rapidly in the direction of the reversal ("C" onwards). But that's an assumption based on my experience with equities; perhaps forex, with it's larger liquidity, operates differently. However, I've read that trades of $100m upward can significantly move less liquid pairs.

Of course there's nothing to stop price from continuing downward from "B" (dotted yellow line), which seems to occur quite frequently. But there's no law that says we have to catch EVERY move, i.e. by taking the "high probability setups" when price is at is most "predictable", we will increase win rate, and hence profit factor (average $$$ won for each $ risked). Like Tradingcube says (post #154).

I realize that the method I've described is very simplistic, and is already widely known. It's not the kind of pattern that would have taken Skunny a million hours (see post #69) to discover.

But we are trying to think about the "who" and "why" that underlies the movements – how the "smart money" might be exploiting a more-predictable-than-normal order queue – rather than the indicators and line studies that TA offers. That is my point – if we're seeking to emulate either JohnW or Skunny, then that is the way we need to start thinking.

(BTW, fundamentalists could justifiably point out that the candle at "C" coincided with the BOE inflation report. The move from "C" to "D" is approx 370 pips, any part of which should represent a reasonable daily take. )

There's a very good post by DarkStar (here: http://www.forexfactory.com/showpost...98&postcount=5) explaining that he looks for inefficiencies. Hence I think he might also be using a "smart money" approach. Somewhere else I recall reading that he expects a 300%–500% p.a. return (although he doesn't talk about risk and drawdowns).

Some other patterns:

1. I've noticed on M15/M30 charts, and more frequently with volatile pairs, that a decent reversal often follows a sudden snapback (longer-than-normal candles) following price "over-reaching" itself. A James16 pin-bar is one possible example of this. Candle "C" is bearish engulfing and substantially longer than usual, in this case.

2. The end of a decent move (M15/M30 charts) is occasionally sign-posted by a longer-than-normal ("exhaustion") candle. (See the candle at "D" in the chart – and since price happens to reverse within the same 15 min, a hammer or pin-bar is formed, in this particular case)

3. Following a decent breakout (e.g. 100+ pips on GBPJPY) from congestion, price often stalls (profit-taking?), before the move resumes for a further (maybe) 30-150 pips. (An example of this in the chart is the candle immediately following "C": a 60 pip correction before the next downward thrust. In this case the correction is halted by the resistance provided by the blue dotted line and arrowed candles. A good place to go short? ).

Each of these patterns may be telling us something about the underlying drivers and order queues. If there is something significant, they may point to "high(er) probability setups" that I alluded to earlier. I've read elsewhere that top traders are selective: they find reasons NOT to trade. (Having said all this, I don't expect that these 3 patterns will deliver anything like the win rate that JohnW is describing ).

A final word about candle patterns. As we know, a candle is nothing more than an OHLC summary of smaller-timeframe candles, and ultimately tick data. The cut-off points (every 15 mins, 30 mins, 1 hour, etc, etc) affect the pattern as much as the price movement that forms the candle. Cut-off points are going to vary since different broker's versions of MT4 use different time zones. PA goes beyond candle patterns.

Sorry, this is a long-winded post. I'm not very good at expressing myself concisely. Hopefully the chart helps it to make some sense. And if I'm talking cr-p, then feel welcome to flame me, but I did warn you that it's all ignorant schoolboy guesswork. Must be time for another Jack Daniels. LOL.

David
____________________________________________

JFX81:
I don't believe JohnW is targeting you personally. His posts on prior threads imply that he's spent money on snake oil from vendors. On review sites like forexbastards.com, there are hundreds of stories of people who believe they've been ripped off. I'm afraid that, if system-sellers and fund managers generally have a bad reputation, it's your competitors who are to blame. Goes without saying that it's no reflection on you personally.

As I mentioned earlier, 240 trades yields statistical error of around +/– 6.5%
500 trades is about +/– 4.4%
1,000 trades is about +/– 3.0%
2,000 trades is about +/– 2.2%
____________________________________________

Th_ngue21:
Congratulations on being +225% this year. I traded live for 3–4 months, and ended –9%. If I was making +225%, I wouldn't be too worried about whether others thought I was right or wrong on a forum. I'd be smiling quietly, and very smugly, to myself. Good on ya!
____________________________________________

STOP PRESS: I started this post a couple of days back. Of course the thread has moved on significantly since then..... Oh what the heck, I've typed it, so I'll post it anyway.
Attached Image (click to enlarge)
Click to Enlarge

Name: abc.gif
Size: 17 KB
 
 
  • Post #183
  • Quote
  • Dec 11, 2007 9:55pm Dec 11, 2007 9:55pm
  •  dagoods
  • Joined Nov 2007 | Status: Member | 2,998 Posts
Quoting Ado
Disliked
What about a line chart, identify S/R levels, and take action acording the direction of the line chart?

That's the way I started in forex, and started making money, then I discovered that almost all the traders used to use candlesticks, indicators, etc. and I thought "damn! I must be completely wrong", started using them, and started losing money .
Ignored

good idea especially if u have s/r levels plotted hmmmmmmm
 
 
  • Post #184
  • Quote
  • Dec 11, 2007 10:30pm Dec 11, 2007 10:30pm
  •  Skunny
  • | Commercial Member | Joined Jan 2007 | 690 Posts
Quote
Disliked
I realize that the method I've described is very simplistic, and is already "D" is approx 370 pips, any part of which should represent a reasonable daily take. )

Hi Han, I need to clear up a few things. I believe John is on his way to being a successful trader. Although we have similar views of the market we trade in completely different ways. WHICH IS GOOD. John is going to share his good ideas with all of you as soon as he's got all his ducks in a row (I'm sure). But, for respect to John I'm not going to press my ideas here in fear it may hinder his teachings. Of course I'll help when I can upon John's OK.

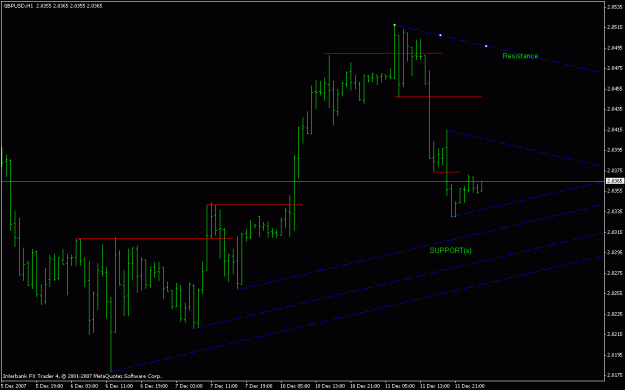
Having said all that...lol. You have done a great deal of anal work and IMHO you are trying to hard (the Jack might help).

Ok, I'll post a chart of GU to help you start thinking (sorry John)

This is not Johns teachings

We've heard S/R crap, but draw yourself a chart similar to this (without the blue Gann lines) Now figure out what happens when these are penetrated (not broken) this is the first step. Now it is important that you watch this live. You can do this on Vhands trading EA (if you don't have it go to Bo's thread on Fibonacci Trading (tell'em I sent ya...lol, we use it all the time a MUST HAVE) Study the PA and follow it after a series of candles. (Bo is not explaining my trading but a great thread). After you trade this on Vhands for 2 months you are ready for more info. 2 months on Vhands is only 8 hours or so.
Attached Image (click to enlarge)
Click to Enlarge

Name: gu.gif
Size: 14 KB
Robonacci com
 
 
  • Post #185
  • Quote
  • Dec 11, 2007 10:33pm Dec 11, 2007 10:33pm
  •  JFX81
  • | Joined Jun 2007 | Status: Scalper | 251 Posts
Quoting hanover
Disliked

JFX81:
I don't believe JohnW is targeting you personally.
Ignored
I agree 100%. It just isn't responsible to bash the whole. Especially since there are a few great people on here who contribute ideas free of charge for the benefit of everyone. The blanket statements slight those of us who legitimately try to lend our thoughts and experience.
Quoting hanover
Disliked
His posts on prior threads imply that he's spent money on snake oil from vendors. On review sites like forexbastards.com, there are hundreds of stories of people who believe they've been ripped off. I'm afraid that, if system-sellers and fund managers generally have a bad reputation, it's your competitors who are to blame. Goes without saying that it's no reflection on you personally.
Ignored
The problem is that we all know the odds of a trader becoming successful. So when someone buys into a "system" or some magic formula they are going to first try to blame others for their own failings. Anyone who thinks it is easy to trade is already set up for disaster. It's just human nature. But I agree there are plenty of scams out there that people should be wary of. Too many neon sign websites for trading, which is a very serious endeavor, cheapen the profession.
 
 
  • Post #186
  • Quote
  • Dec 11, 2007 10:49pm Dec 11, 2007 10:49pm
  •  John Pope
  • | Joined May 2007 | Status: Member | 8 Posts
Maybe this is the secret...

http://www.financialsense.com/fsu/ed...2007/1211.html


  • Post #187
  • Quote
  • Dec 11, 2007 10:49pm Dec 11, 2007 10:49pm
  •  Skunny
  • | Commercial Member | Joined Jan 2007 | 690 Posts
Quoting JFX81
Disliked
I agree 100%. It just isn't responsible to bash the whole. Especially since there are a few great people on here who contribute ideas free of charge for the benefit of everyone. The blanket statements slight those of us who legitimately try to lend our thoughts and experience.
The problem is that we all know the odds of a trader becoming successful. So when someone buys into a "system" or some magic formula they are going to first try to blame others for their own failings. Anyone who thinks it is easy to trade is already set up for disaster. It's just human nature. But I agree there are plenty of scams out there that people should be wary of. Too many neon sign websites for trading, which is a very serious endeavor, cheapen the profession.
Ignored
If I tell you how I want my money traded(handing over the Grail...lol) would you manage an acct? Just curious. Thanks.
Robonacci com
 
 
  • Post #188
  • Quote
  • Dec 11, 2007 10:51pm Dec 11, 2007 10:51pm
  •  Skunny
  • | Commercial Member | Joined Jan 2007 | 690 Posts
Quoting John Pope
Disliked
Maybe this is the secret...

http://www.financialsense.com/fsu/ed...2007/1211.html

Ignored
You're not to far off the mark.
Robonacci com
 
 
  • Post #189
  • Quote
  • Dec 11, 2007 11:02pm Dec 11, 2007 11:02pm
  •  jones247
  • | Joined Aug 2007 | Status: Member | 264 Posts
Quoting digimix
Disliked
eagle-eye, the trader I spoke of does not share his method with no one, not even his wife (or so she said)
Ignored
Hi Digimix,

I'm quite familar with the trader you've been referencing. Be advised that he has a team of traders at his disposal... at least that's my understanding on David's company...

Walt
 
 
  • Post #190
  • Quote
  • Dec 11, 2007 11:03pm Dec 11, 2007 11:03pm
  •  John Pope
  • | Joined May 2007 | Status: Member | 8 Posts
Interesting. From the initial post, I assumed the method had nothing to do with Gann, Fibs or any other pre-calculated price/time stuff.

Quoting Skunny
Disliked
You're not to far off the mark.
Ignored
 
 
  • Post #191
  • Quote
  • Dec 12, 2007 12:29am Dec 12, 2007 12:29am
  •  JFX81
  • | Joined Jun 2007 | Status: Scalper | 251 Posts
Quoting Skunny
Disliked
If I tell you how I want my money traded(handing over the Grail...lol) would you manage an acct? Just curious. Thanks.
Ignored
Do you mean if you handed me a system or set of rules to trade by would I robotically enter under those guidelines?

I don't understand if that is what you are necessarily asking...
 
 
  • Post #192
  • Quote
  • Edited at 1:38am Dec 12, 2007 12:51am | Edited at 1:38am
  •  SunTrader
  • Joined Mar 2006 | Status: Trade the reaction not the news! | 10,381 Posts
I looked back at the chart (NZDUSD) referenced in that newsletter with the "secret".

It wasn't mentioned that after the March/April lows in '06 there was another low in that vicinity in late June. This low as well as those earlier lows lined up with a low from May '04 in other words previous support.

Also I am posting a chart with Tom DeMark TD Trend Factor applied to the '06 period which comes within 0.0010 of the exact low. This happens quite frequently. No magic, just multiplying previous swing highs/lows by a factor.

Notice also on that link a 2nd chart (line on close) shows a double bottom which is the low in June '06. Do they mean to say that long trade would have been held on a retrace below entry point back in March/April? I'm Curious.

Edit: Added a 161.8% fib projection of prior swing which = 0.59333

I guess its another example of self-fulfilling prophecy of fibs. Yeah right, fractionally amount away from the swing low. I wasn't watching back then but there must have been a lot who were and maybe just maybe there is something to this counting rabbits kind of math.
Attached Image (click to enlarge)
Click to Enlarge

Name: NZDUSD.jpg
Size: 58 KB
 
 
  • Post #193
  • Quote
  • Dec 12, 2007 1:59am Dec 12, 2007 1:59am
  •  hanover
  • Joined Sep 2006 | Status: ... | 8,089 Posts
Quoting John Pope
Disliked
Maybe this is the secret...

http://www.financialsense.com/fsu/ed...2007/1211.html

Ignored
John, many thanks..... very interesting. Looks like I should have paid more attention when I was in Bible class! I'm familiar with some of this material in relation to end-time prophecy, but never realized it had a bearing in the financial markets.

[Curiously, the author (John Needham) lives in Taupo, the town where I spent my early childhood. (I now live in Hamilton, about 2 hours drive to the north......) ......but I digress.....]

What intrigues me is the statement "The theme of this article is that the Daniel sequence creates significant numbers that markets recognise but others do not see."

I wonder what is meant by "markets"..... I thought that markets comprised traders, but this seems to suggest that the "market" is a kind of mythical being in its own right, and has an agenda of its own? Not an easy concept for me to grasp.

Anyway, thanks very much for the link.

David
__________________________________

Quoting Skunny
Disliked
....You have done a great deal of anal work and IMHO you are trying too hard (the Jack might help).....
Ignored
Just as well this is a trading forum.....LOL

[mods, please feel welcome to delete this, if it's too offensive..... but I have read the Comedy Club thread, and a lot of material there seems to escape the censor's knife.....]
 
 
  • Post #194
  • Quote
  • Dec 12, 2007 2:45am Dec 12, 2007 2:45am
  •  Ronyn76
  • | Joined Oct 2006 | Status: Lord Of The Pips? | 227 Posts
Quoting JohnW
Disliked
LOL again. The purpose of my initial post was to draw attention to the fact that once you realize that there is no indicator (or set of indicators) that works as system vendors claim, you are on the way to successful trading. Indicators are derivatives of PA, so why not make trade decisions off of PA? Does that make sense?

I am giving my system away for free (JFX81 – will you?) because this forum and those who also gave their time and advice for free have helped me greatly. Even those that flamed my and others posts helped to stimulate thought. I can not overemphasize the benefit of this and my gratitude.


The fact is that I have found my “holy grail”, it may not be your “holy grail”, but if you listen to many of those who post here, think about what is said in proper context, and think about what should work and why, you could design your own holy grail. Many successful traders have done just that. The key is that once you believe in it, it is easy to follow it with discipline.


I have finished the first draft of the .doc file mentioned in an earlier post. I will be sending it to a few posters to this thread for evaluation and comments. I am not looking to put together some slick trading program with lots of charts/examples, hype, or theory for eventual sale. My objective is to make it somewhat comprehensive so that nearly all forex traders with some experience will be able to understand it and trade with it. It will not be for newbies. However, I still believe that the best way to train traders is to do it person-to-person in front of a live trading platform.
Ignored
Hi John, when you have finished the document I would love to have a look at it.

regards
Liberate me ex inferis
 
 
  • Post #195
  • Quote
  • Dec 12, 2007 4:46am Dec 12, 2007 4:46am
  •  bobblong
  • | Joined Jun 2007 | Status: --... | 621 Posts
Quoting Skunny
Disliked
We've heard S/R crap, but draw yourself a chart similar to this (without the blue Gann lines) Now figure out what happens when these are penetrated (not broken) this is the first step. Now it is important that you watch this live. You can do this on Vhands trading EA (if you don't have it go to Bo's thread on Fibonacci Trading (tell'em I sent ya...lol, we use it all the time a MUST HAVE) Study the PA and follow it after a series of candles. (Bo is not explaining my trading but a great thread). After you trade this on Vhands for 2 months you are ready for more info. 2 months on Vhands is only 8 hours or so.
Ignored
I've replayed this chart on Sierra ... So minor S/R gets cracked and price falls/shoots through... this is what you are trying to say? What is the difference between penetrated and broken? If something is penetrated then it has been broken.. To be honest I fail to see the probable edge.. perhaps we need that 'more info'

Rgds
Bob.
 
 
  • Post #196
  • Quote
  • Dec 12, 2007 4:53am Dec 12, 2007 4:53am
  •  shinny
  • Joined Sep 2007 | Status: Trading The Matrix | 819 Posts
Quoting pfdtrader22
Disliked
I didn't mean to imply that none of us foster ANY skepticism in our heart, but in trading, as in life, we are not after the pursuit of skepticism, we pursue the possible, in all aspects and venues. And the only way to determine the possible, is to pursue, to seek. If you haven't read "Market Wizards" or "The New Market Wizards" (I forget which one), the section on Steve Weinstein might interest you.
Ignored

Thanks for message, but i am unable to send private messages or emails to you.

shinny
Nobody can be told what The Matrix is. You'll have to see it yourself.
 
 
  • Post #197
  • Quote
  • Dec 12, 2007 5:04am Dec 12, 2007 5:04am
  •  pfdtrader22
  • | Joined Apr 2007 | Status: Profit Pig | 69 Posts
Quoting shinny
Disliked
Thanks for message, but i am unable to send private messages or emails to you.

shinny
Ignored

Sorry bro, didn't realize that. I just pm'ed you my email addy. Thanks again.
 
 
  • Post #198
  • Quote
  • Dec 12, 2007 5:55am Dec 12, 2007 5:55am
  •  Gknarf
  • | Joined Nov 2007 | Status: Member | 33 Posts
Quoting bobblong
Disliked
I've replayed this chart on Sierra ... So minor S/R gets cracked and price falls/shoots through... this is what you are trying to say? What is the difference between penetrated and broken? If something is penetrated then it has been broken.. To be honest I fail to see the probable edge.. perhaps we need that 'more info'

Rgds
Bob.
Ignored
Hi Bob

I think that you need to let the candle close before making a decision.

A penetration is only by the wick of the candle, whereas a break is when the candle has closed over the boundary and firmly into new territory.

This is what I am led to believe

Frank
 
 
  • Post #199
  • Quote
  • Dec 12, 2007 6:08am Dec 12, 2007 6:08am
  •  bobblong
  • | Joined Jun 2007 | Status: --... | 621 Posts
Quoting Gknarf
Disliked
Hi Bob

I think that you need to let the candle close before making a decision.

A penetration is only by the wick of the candle, whereas a break is when the candle has closed over the boundary and firmly into new territory.

This is what I am led to believe

Frank
Ignored
That would completely defy the usefulness.. By the time a candle closes past these points any substantial movement has alreay occured. Let's see what Skunny has in mind
 
 
  • Post #200
  • Quote
  • Dec 12, 2007 7:36am Dec 12, 2007 7:36am
  •  blueruby
  • Joined Feb 2007 | Status: Stock Broker, October 1987 | 1,299 Posts
Quoting bobblong
Disliked
That would completely defy the usefulness.. By the time a candle closes past these points any substantial movement has alreay occured. Let's see what Skunny has in mind
Ignored
It depends on your trading style / strategy / system, and the pair.

As a rule, I don't trade a trendline or S/R breakout unless a candle closes across the line. Most of the time I wait for another closed candle, with a full body across the line (wicks can touch or cross the line). If they are 30 minute candles or higher, all the better, but I'm usually not that patient, and will go with 15m NO LOWER.

The way action is going today, I've passed on several trades that meet both the above criteria, just because the market is so undecided and it isn't crossing any lines with any conviction.

To your point, with G/J, sometimes I get sucked in. You can't always wait for closed candles with that pair or you will miss the move, AND, the farther it goes, the farther away your stop is. The downside is that it can reverse on you just as fast.
 
 
  • Rookie Talk
  • /
  • The Holy Grail - Found
  • Reply to Thread
    • 1 89Page 101112 46
    • 1 9Page 1011 46
0 traders viewing now
  • More
Top of Page
  • Facebook
  • Twitter
About FF
  • Mission
  • Products
  • User Guide
  • Media Kit
  • Blog
  • Contact
FF Products
  • Forums
  • Trades
  • Calendar
  • News
  • Market
  • Brokers
  • Trade Explorer
FF Website
  • Homepage
  • Search
  • Members
  • Report a Bug
Follow FF
  • Facebook
  • Twitter

FF Sister Sites:

  • Metals Mine
  • Energy EXCH
  • Crypto Craft

Forex Factory® is a brand of Fair Economy, Inc.

Terms of Service / ©2022