Yesterday predicted chaos finally gave about 45pips
after Fed Chairman's speech. That is from the edge of
chaos:
So what is the trick:
-----------
All chaos systems are behavioral and deterministic: financial chaos is no exception. This means that if you use chaos, you know exactly what the market want to do, where it want to turns, and extent it will turn. It is like a crystal ball. You will know what a pair will do when London opens and when New York opens and closes. If it does not follow that behaviour, you know that the market is misbehaving and you will know what to do to avoid ruins.
-------------------
This is the same as :
“If we knew exactly the laws of nature and the situation of the universe at the initial moment we could predict exactly the situation of that same universe at a succeeding moment.” - Henri Poincaré, Father of Chaos theory.
---------------------------
Today's commentary:
There will be no commentary today as I will am going out
of town for some few days to attend funeral services of my
late father in law
The commentary will resume Monday/Tuesday.
I have uploaded new file on FAQ. These are real questions
people are asking about financial chaos methods.
__________________
To get it just subscribe below!
I did not trade last Friday.
The first thing I did when I returned from my travel is
to trace the end of Friday's chaos and I entered to buy.
For several hours the trade has not given more than
6pips as at the time of writing this. I will remain
with this trade until after London opens.
-------------------------------------
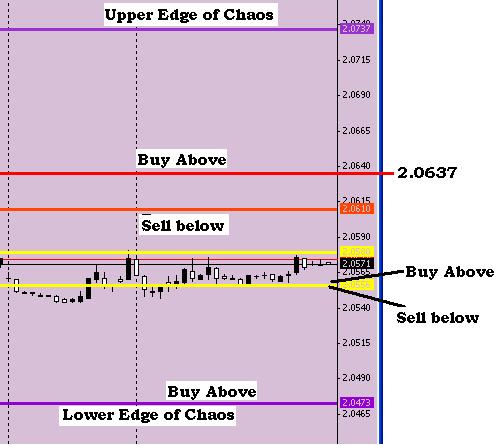
General Chaos = Bearish.
Areas of critical point that may affect price behaviours
are show on the graph below
a). 2.0636, represent a bearish turning point if it does not turned
at 2.0610
b) if 2.0636 is breached chaos will turn bullish until the upper edge of chaos (2.0672)
c): Take note upper edge is adjusted to 2.0672 not 2.0737
If unable to move above 2.0610 after London, I will close
buy and sell to the lower edge of chaos 2.0473/2.0436
I did not trade last Friday.
The first thing I did when I returned from my travel is
to trace the end of Friday's chaos and I entered to buy.
For several hours the trade has not given more than
6pips as at the time of writing this. I will remain
with this trade until after London opens.
-------------------------------------
General Chaos = Bearish.
Areas of critical point that may affect price behaviours
are show on the graph below
a). 2.0636, represent a bearish turning point if it does not turned
at 2.0610
b) if 2.0636 is breached chaos will turn bullish until the upper edge of chaos (2.0672)
c): Take note upper edge is adjusted to 2.0672 not 2.0737
If unable to move above 2.0610 after London, I will close
buy and sell to the lower edge of chaos 2.0473/2.0436
Ignored
Before I finished posting the trade actually moved as predicted
but I will be looking at a break above 2.0610 and remain bullish
until after London opens.
Before I finished posting the trade actually moved as predicted
but I will be looking at a break above 2.0610 and remain bullish
until after London opens.
Ignored
A touch of 2.0610 was fast, but that is not a break
from here I will manage and consolidate pips +40pip
below 2.0602
I did not trade last Friday.
The first thing I did when I returned from my travel is
to trace the end of Friday's chaos and I entered to buy.
For several hours the trade has not given more than
6pips as at the time of writing this. I will remain
with this trade until after London opens.
-------------------------------------
General Chaos = Bearish.
Areas of critical point that may affect price behaviours
are show on the graph below
a). 2.0636, represent a bearish turning point if it does not turned
at 2.0610
b) if 2.0636 is breached chaos will turn bullish until the upper edge of chaos (2.0672)
c): Take note upper edge is adjusted to 2.0672 not 2.0737
If unable to move above 2.0610 after London, I will close
buy and sell to the lower edge of chaos 2.0473/2.0436
Ignored
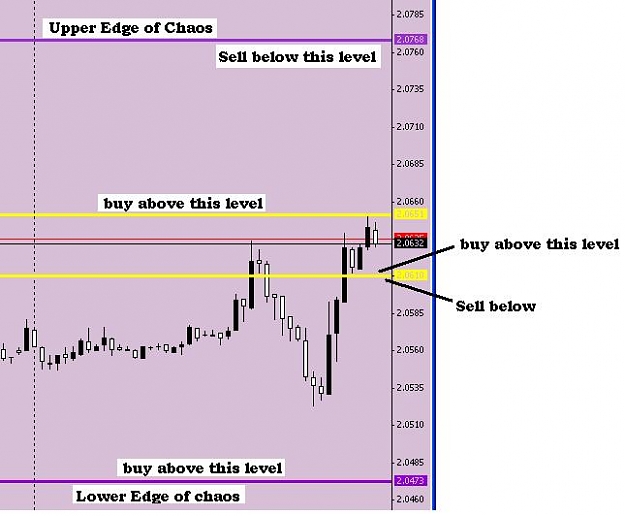
Nothing changes my outlook except waiting
for London to open.
Sell below 2.0636 or below 2.0610: better
from 2.0636 downward if initial condition favours
bearish trend today.
Or else I will go bullish from above 2.0636 to 2.0672
I have taken a bearish stand as shown by the graph for
today. I will be aiming at the lower edge, since I have
already consolidated 56pips.
But trade need to break 2.0576 and then
2.0545 before bearish chaos can be sustained
I wish you happy trading
Ignored
Trade behave as predicted so far.
But there should be a better clearance
away from 2.0546 before one can be confident
that we will get to lower edge quickly.
There is fundamental news coming up
( Manufacturing PMI) in less than 20mins from now.
Previous was 52.9
forecast = 52.5
if data is 52.5 or below, this sell should continue
to lower edge. if it is above 52.9, I will close my
trade and watch the market reaction to the news.
Currently my stoploss is at 2.0594 - 1 pip profit.
Ignored
Position liquidated at 46pips
46+56 =102
I will be looking forward to sell again
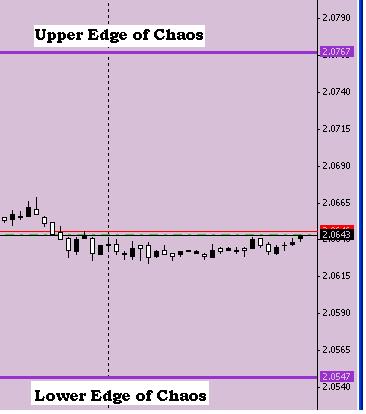
Today is bearish chaos
Ideally I would love to sell from 2.0636 but I am not in at the moment
1. Internal structure of this current chaos is showing uprising
bullish fractal patterns from 5mins frame to daily time frame.
2. Hourly has thrown in a strong reversal candle pattern, though
this is irrelevant to me. If it breaks 2.0636, bullish may prevail
3. Upcoming news supporting this sentiment is as follow
ISM Manufacturing Index
forecast = 50.5
Previous = 50.9
If fall below 50.5 bullish may continue
If it is higher than 50.9 sell may continue
According FF a rising trend has a positive effect
on the nation's currency.
This is why I will prefer to enter sell at
2.0636 and sell below it, with stop loss
at that level. but meanwhile I will prefer
to watch the market even it means not
trading again today.
Ignored
The warning was ok, and market actually overtook
my posting.
General Chaos = Bearish.
Areas of critical point that may affect price behaviours
are show on the graph below
a). 2.0636, represent a bearish turning point if it does not turned
at 2.0610
b) if 2.0636 is breached chaos will turn bullish until the upper edge of chaos (2.0672)
c): Take note upper edge is adjusted to 2.0672 not 2.0737
If unable to move above 2.0610 after London, I will close
buy and sell to the lower edge of chaos 2.0473/2.0436
Ignored
I am still not in the trade again.
I will wait for the news or may wait till
everything cool off if it is not going to sell below
2.0636
If I missed entry, I will wait. Tomorrow is another day.