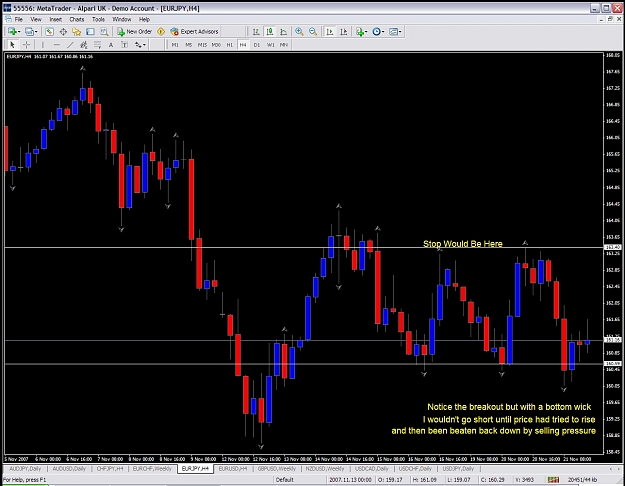
• Home
  • Forums
  • Trades
  • News
  • Calendar
  • Market
  • Brokers
  • Login
  • Join
  • User/Email: Password:
  • 10:19am
Menu
  • Forums
  • Trades
  • News
  • Calendar
  • Market
  • Brokers
  • Login
  • Join
  • 10:19am
Sister Sites
  • Metals Mine
  • Energy EXCH
  • Crypto Craft

Options

Bookmark Thread

First Page First Unread Last Page Last Post

Print Thread

Similar Threads

Point pivot trend line and fibo system (Semafor included) 14 replies

Indicator fix...code included.. WHATS WRONG?!? 4 replies

An interesting read - Daily and 60 Min Strategy - Charts included 3 replies

  • Trading Systems
  • /
  • Reply to Thread
  • Subscribe
  • 244
Attachments: The System (Irony included)
Exit Attachments
Tags: The System (Irony included)
Cancel

The System (Irony included)

  • Last Post
  •  
  • 1 3738Page 394041 59
  • 1 38Page 3940 59
  •  
  • Post #761
  • Quote
  • Nov 21, 2007 3:51pm Nov 21, 2007 3:51pm
  •  feb2865
  • | Commercial Member | Joined Jun 2006 | 1,578 Posts
Quoting Mr Trend
Disliked
Depends. If you follow the way feb would trade, you would've had some losses, because, as I understand it, (let's assume a downtrend) you get a up bar, then you get a bar breaking that high, THEN, you enter off the break of that... which means you've missed most of the move.

That's why I enter as soon as I get an engulfing bar, or I see a pinbar break. Just seems easier than having to figure out some sort of "V" formation and all that. BEOBs, BUOBs, PBs, etc., just seem easier to me.

I could be drinking too much already today though, so who knows...
Ignored
He's trading on lower time frames That's true he would have some loses using my method.

Peace
Peace
 
 
  • Post #762
  • Quote
  • Nov 21, 2007 3:53pm Nov 21, 2007 3:53pm
  •  Mr Trend
  • Joined Apr 2006 | Status: Mmmm pips. | 1,418 Posts
Quoting iandekoker
Disliked
Oops last chart
Ignored
This USDCAD is a perfect example of what I wouldn't trade. The first bar up, didn't engulf the last. And then the move took off. You have no idea if that 4H resistance is gonna hold or not, so, IMO, you'd just be lucky if you took that early right off the first up candle. If you waited to get in after the second candle confirmed (the big white one), then you are now sitting on a loss...

That's how it is with PA... S&R rules king. I admire feb because the dude just trails it... Not me, because 9 times out of 10, S&R will hold at least for a day, and I hate sitting here looking at my chart worried that I'm gonna give up 200 pips of profit from that run up....

Just me I suppose...
Mr. Trend
 
 
  • Post #763
  • Quote
  • Nov 21, 2007 3:54pm Nov 21, 2007 3:54pm
  •  Mr Trend
  • Joined Apr 2006 | Status: Mmmm pips. | 1,418 Posts
Quoting feb2865
Disliked
He's trading on lower time frames That's true he would have some loses using my method.

Peace
Ignored
That's right.... that makes sense because typically a daily or weekly will follow through, which is what you're betting on...

Ok, back to the Captain and Coke... ROFL.
Mr. Trend
 
 
  • Post #764
  • Quote
  • Nov 21, 2007 4:22pm Nov 21, 2007 4:22pm
  •  feb2865
  • | Commercial Member | Joined Jun 2006 | 1,578 Posts
Mr Trend

Patience is a big deal on this method believe me. It has been a big deal to me as I come from world that people use to kill themselves for 1 tick

I tell you I have a balance 'cause I trade some other stuff like e-mini's etc.

Are you Planning to put a bet on Gold??? looks really nice!!!!

Peace
Peace
 
 
  • Post #765
  • Quote
  • Nov 21, 2007 4:47pm Nov 21, 2007 4:47pm
  •  Mr Trend
  • Joined Apr 2006 | Status: Mmmm pips. | 1,418 Posts
Quoting feb2865
Disliked
Patience is a big deal on this method believe me. It has been a big deal to me as I come from world that people use to kill themselves for 1 tick.
Ignored
Agreed.

Quoting feb2865
Disliked
I tell you I have a balance 'cause I trade some other stuff like e-mini's etc.
Ignored
Yeah. That's how most guys are I think...

Quoting feb2865
Disliked
Are you Planning to put a bet on Gold??? looks really nice!!!!
Ignored
You bet. I'm in at 803.50... My first scale out is 850... or, I might take the whole thing right there... depends on what PA does at that point. I would expect a slight correction, and then breakthrough... I see gold at 1000 long term (mid-2008 if not earlier)...
Mr. Trend
 
 
  • Post #766
  • Quote
  • Nov 21, 2007 4:50pm Nov 21, 2007 4:50pm
  •  Scooter
  • | Joined May 2004 | Status: Member | 64 Posts
Quoting Old_Not_Dead
Disliked

As for how I deal with false breakouts, I tend to avoid trading breakouts in the main. Of course, there are always occasions where a breakout interests me (based on the preceding market structure) but I would usually wait on the retracement before getting in. Sure, sometimes there is no retracement and it just keeps going but I'm happy to let those ones go rather than chasing the market.

O N D
Ignored
Hi OND. Thanks for your contributions (as well as Feb, Mr Trend and others).

I learn best with chart examples. Sometime in the future could you post an example of the above and mark where at the retrace you would have entered as well as your stop placement?

Thanks!

And for those celebrating tomorrow where every you reside.......Happy Turkey Day! The lounge chair is all set for some American Football.
Still haven't found what I'm looking for...
 
 
  • Post #767
  • Quote
  • Nov 21, 2007 5:03pm Nov 21, 2007 5:03pm
  •  Trader_V
  • | Joined Jun 2006 | Status: Patience, Discipline & Desire!!! | 291 Posts
Hi Scooter,

I understand what yo umean I am a very visual person myself.

I am not one for speaking for others but I believe this is what OND is speaking of by waiting for a retracement and then entering.

The pic should speak for itself.

Hope this helps.

Trader_V

Quoting Scooter
Disliked
Hi OND. Thanks for your contributions (as well as Feb, Mr Trend and others).

I learn best with chart examples. Sometime in the future could you post an example of the above and mark where at the retrace you would have entered as well as your stop placement?

Thanks!

And for those celebrating tomorrow where every you reside.......Happy Turkey Day! The lounge chair is all set for some American Football.
Ignored
Attached Image (click to enlarge)
Click to Enlarge

Name: range break out.gif
Size: 30 KB
Nothing is impossible, with a willing mind!
 
 
  • Post #768
  • Quote
  • Nov 21, 2007 5:15pm Nov 21, 2007 5:15pm
  •  Old_Not_Dead
  • Joined Nov 2007 | Status: Member | 110 Posts
Quoting Trader_V
Disliked
Hi Scooter,

I understand what yo umean I am a very visual person myself.

I am not one for speaking for others but I believe this is what OND is speaking of by waiting for a retracement and then entering.

The pic should speak for itself.

Hope this helps.

Trader_V
Ignored
Thanks Trader V

Hi Scooter,

Apologies, I realise that some people understand better through seeing a practical example so I'll have a look for another one I can use to demonstrate the point and post it.

O N D
 
 
  • Post #769
  • Quote
  • Nov 21, 2007 5:32pm Nov 21, 2007 5:32pm
  •  Old_Not_Dead
  • Joined Nov 2007 | Status: Member | 110 Posts
Here you go Scooter

This isn't a brilliant example as I probably will not be taking a trade on this market now due to the structure and the time of year. It is a live example though - taken just a few minutes ago. Hopefully it will demonstrate how I treat most breakouts. I stress most as, at the risk of keeping saying the same thing, every price action structure is in part individual and therefore I approach the chart from a slightly discretionary angle.

But anyway, let's just assume I'm wanting to get short this pair now that the breakout has occurred. What I'm looking for is for price to try to climb again and to be beaten down dramatically. That way I have more of a clue as to who is in control of the direction and that there is appetite to sell at a certain level.

As I type, the not yet completed bar is creating a structure that suggests to me the next bar will be convincingly bearish. If that's the case, my signal to get in would be in place (theoretically as I'm not trading this today!).

I've marked where my stop would be. And yeah, I like wide stops I want to give my trades room to mature. Not everyone will be suited to that style and that's not a problem. One thing to note though is that my stops very rarely get triggered. Not because I'm always right (!!) but because I actively manage the trade and the price action usually tells me I'm wrong long before my stop confirms it.

Hope that's of some use.
Attached Image (click to enlarge)
Click to Enlarge

Name: eurjpy2.jpg
Size: 359 KB
 
 
  • Post #770
  • Quote
  • Nov 21, 2007 6:04pm Nov 21, 2007 6:04pm
  •  iandekoker
  • | Joined Apr 2007 | Status: Member | 515 Posts
Quoting Mr Trend
Disliked
Depends. If you follow the way feb would trade, you would've had some losses, because, as I understand it, (let's assume a downtrend) you get a up bar, then you get a bar breaking that high, THEN, you enter off the break of that... which means you've missed most of the move.

That's why I enter as soon as I get an engulfing bar, or I see a pinbar break. Just seems easier than having to figure out some sort of "V" formation and all that. BEOBs, BUOBs, PBs, etc., just seem easier to me.

I could be drinking too much already today though, so who knows...
Ignored
Yip nothing wrong in the way you approach it.
 
 
  • Post #771
  • Quote
  • Nov 21, 2007 6:06pm Nov 21, 2007 6:06pm
  •  iandekoker
  • | Joined Apr 2007 | Status: Member | 515 Posts
Quoting feb2865
Disliked
Good Jon Iandekoker

I am really impressed

It's unbelievable how the markets respects pivots.

Keep the good work!!!!!

Peace
Ignored
Thx feb. Today was good. Tomorrow should be very slow due to US public holiday. And then friday is golf day....so i am pretty much done for the week
 
 
  • Post #772
  • Quote
  • Nov 21, 2007 6:41pm Nov 21, 2007 6:41pm
  •  Scooter
  • | Joined May 2004 | Status: Member | 64 Posts
Thanks TV & OND!

Those pictures definitely help out!

Once in then it then I assume you let the market tell you when to get out as far as PA & reversal patterns etc.

Of course there many stategies to get as well .... but I'll just worry about getting in properly at this point!

Thanks again!

Scooter
Still haven't found what I'm looking for...
 
 
  • Post #773
  • Quote
  • Nov 22, 2007 4:00am Nov 22, 2007 4:00am
  •  iandekoker
  • | Joined Apr 2007 | Status: Member | 515 Posts
I dont trade eur/usd as often as i did, but listening to all the "experts" setting a target of 1.5000 for this currrency makes me wanna short this pair for the following reasons:

1. What is gonna happen once eur/usd reaches 1.5000? I expect a sell off once profit taking starts.

2. I dont think a lot of people are taking on new long positions due to the extreme highs that this pair is currently trading at. I would like to believe most traders are slowly taking profits.

3. There hasn't been any significant correction since the start of this uptrend. So a correction is due at same stage.

4. Does it have room to go up even further? Yes it has. But the question is will it. Cause ECB said they would intervene once eur/usd hits 1.5000 level because such a strong euro would not be good for europe's economy.

So i have decided to go short on this pair and for a good risk/reward it seems like a very good oppertunity. I will put my stop loss at 1.5100. And put my take profit between 50% and 61% fib retracement. That is a potential 800 pips for risking little over 300 pips. Good risk/reward.

Of course it is a long term trade and i only expect to reach take profit levels around 1st quater of next year. In the mean time i will also get a swap.

What is this trade based on? It is based purely on risk/reward. There are no fundamentals to support my decision.
Attached Image (click to enlarge)
Click to Enlarge

Name: gbp usd3.gif
Size: 14 KB
 
 
  • Post #774
  • Quote
  • Nov 22, 2007 6:43am Nov 22, 2007 6:43am
  •  alcastro
  • | Joined Sep 2006 | Status: Pipchaser | 512 Posts
Here is how I played the cable: entered after the V formation., right after the 2nd candle was broken to the upside. Got stopped the first time but in again using Jacko's anti-hedge system. So far I am in profit. I am not planninmg to move my SL until I see more movement to the upside. But I do not think we will see a lot of action this week due to Thanksgiving in the US. As FEB said, this week may be a snoozefest.
Attached Image (click to enlarge)
Click to Enlarge

Name: cable_nov22.gif
Size: 24 KB
 
 
  • Post #775
  • Quote
  • Nov 22, 2007 8:23am Nov 22, 2007 8:23am
  •  iandekoker
  • | Joined Apr 2007 | Status: Member | 515 Posts
Quoting alcastro
Disliked
Here is how I played the cable: entered after the V formation., right after the 2nd candle was broken to the upside. Got stopped the first time but in again using Jacko's anti-hedge system. So far I am in profit. I am not planninmg to move my SL until I see more movement to the upside. But I do not think we will see a lot of action this week due to Thanksgiving in the US. As FEB said, this week may be a snoozefest.
Ignored
Yip excellent trade.

However i am not familiar with Jacko's anti hedging system and also too lazy to go look it up. Can u maybe give us a quick summary of his system.
 
 
  • Post #776
  • Quote
  • Nov 22, 2007 9:18am Nov 22, 2007 9:18am
  •  iandekoker
  • | Joined Apr 2007 | Status: Member | 515 Posts
While the market is so boring i am already looking out for possible oppertunities next week.

I see lots of potensial in this usd/cad charts.

First the weekly charts tell me that we have an uptrend underway. The stochastics support this.

The daily charts agree with the weekly charts.

Then i will wait for the market to come to me on the 4hr charts. Firstly i will look for a retest of the weekly and monthly pivot points. And once the market rejects thosel levels and price closes above those levels i will go long. I might even wait for daily close above those levels before getting in. And then i will ride this trade all the way up to 1.0447 level which is monthly R3 giving us a 600 pipper. My stop loss would be under monthly pivot point.

I dont mind trading other currencies even though I favor gbp/usd, but then i will only trade them if the market comes to me. I will never chase after the market.

This is another good risk/reward trade. I will risk about 80-100 pips in order to make 600.
Attached Image(s) (click to enlarge)
Click to Enlarge

Name: gbp usd3.gif
Size: 12 KB
Click to Enlarge

Name: gbp usd.gif
Size: 12 KB
Click to Enlarge

Name: gbp usd1.gif
Size: 12 KB
 
 
  • Post #777
  • Quote
  • Nov 22, 2007 9:31am Nov 22, 2007 9:31am
  •  iandekoker
  • | Joined Apr 2007 | Status: Member | 515 Posts
Here is also a excellent potential oppertunity on gbp/jpy. This is the much anticipated head and shoulders on the weekly charts. As we know head and shoulders is a powerful reversal chart pattern.

Now once the neckline gets broken we will have a short trade that could run all the way down to 199.00 level.

This is definately a trade to watch. The potential profits are hugh.

I will wait for a clean break of the neckline and then place my stop loss above the neckline and let this baby run her course.
Attached Image (click to enlarge)
Click to Enlarge

Name: gbp usd.gif
Size: 15 KB
 
 
  • Post #778
  • Quote
  • Nov 22, 2007 9:37am Nov 22, 2007 9:37am
  •  Trader_V
  • | Joined Jun 2006 | Status: Patience, Discipline & Desire!!! | 291 Posts
OND,

This is perfect! Back in post #641

http://www.forexfactory.com/showpost...&postcount=641

I talked about this type of setup exactly. Only the example I showed there did not portray exactly what I was trying to get across. Talk about complimenting each others methods and posts...lol

What a great learning tool we are putting together here

Ok so real quickly on the chart I have posted here, I would like to point out that even though we obviouly have different data feeds based on our brokers we still show the same basic thing.

The blue lines represent where OND had originally drawn his lines The yellow line is where I would have drawn the bottom of my range. This is nothing more than a preference.

I marked the candle that shows the breakout and thr Slaghter Zone as I like to refer to it. Then a retrace. The second arrow indicates the last candle shown on OND's chart. Immediatley following you can see a nice formation occurring showing there is some nice selling pressure going on.

Once prices continue downward I would express caution in the Red Flag Zone

This is where prices found previous support and could be rejected again.

Cheers!

Quoting Old_Not_Dead
Disliked
Here you go Scooter

This isn't a brilliant example as I probably will not be taking a trade on this market now due to the structure and the time of year. It is a live example though - taken just a few minutes ago. Hopefully it will demonstrate how I treat most breakouts. I stress most as, at the risk of keeping saying the same thing, every price action structure is in part individual and therefore I approach the chart from a slightly discretionary angle.

But anyway, let's just assume I'm wanting to get short this pair now that the breakout has occurred. What I'm looking for is for price to try to climb again and to be beaten down dramatically. That way I have more of a clue as to who is in control of the direction and that there is appetite to sell at a certain level.

As I type, the not yet completed bar is creating a structure that suggests to me the next bar will be convincingly bearish. If that's the case, my signal to get in would be in place (theoretically as I'm not trading this today!).

I've marked where my stop would be. And yeah, I like wide stops I want to give my trades room to mature. Not everyone will be suited to that style and that's not a problem. One thing to note though is that my stops very rarely get triggered. Not because I'm always right (!!) but because I actively manage the trade and the price action usually tells me I'm wrong long before my stop confirms it.

Hope that's of some use.
Ignored
Attached Image (click to enlarge)
Click to Enlarge

Name: range break out 2.gif
Size: 28 KB
Nothing is impossible, with a willing mind!
 
 
  • Post #779
  • Quote
  • Nov 22, 2007 11:04am Nov 22, 2007 11:04am
  •  Old_Not_Dead
  • Joined Nov 2007 | Status: Member | 110 Posts
Quoting Trader_V
Disliked
OND,

This is perfect! Back in post #641

http://www.forexfactory.com/showpost...&postcount=641

I talked about this type of setup exactly. Only the example I showed there did not portray exactly what I was trying to get across. Talk about complimenting each others methods and posts...lol

What a great learning tool we are putting together here

Ok so real quickly on the chart I have posted here, I would like to point out that even though we obviouly have different data feeds based on our brokers we still show the same basic thing.

The blue lines represent where OND had originally drawn his lines The yellow line is where I would have drawn the bottom of my range. This is nothing more than a preference.

I marked the candle that shows the breakout and thr Slaghter Zone as I like to refer to it. Then a retrace. The second arrow indicates the last candle shown on OND's chart. Immediatley following you can see a nice formation occurring showing there is some nice selling pressure going on.

Once prices continue downward I would express caution in the Red Flag Zone

This is where prices found previous support and could be rejected again.

Cheers!
Ignored
Hey TV (I think i'll call you that from now on!),

It's great that you recognised the setup based on your own preferences. I'm finding it quite difficult to take what is in my head and put it down in writing. When you add in my mantra that "no two setups are exactly the same" it makes it even more difficult to convey how I'd approach situations.

The bottom of the range you have drawn is correct. I pulled an old schoolteacher trick and exaggerated mine for the purpose of explaining the false breakout.

To keep this example going, I've just had a fresh look at the EURJPY 4Hr chart and I still favour the downside. However, everything is grinding to a halt now in terms of true volatility and therefore I'll have to look at things again next week. We got a bit of selling pressure after the run up to 162.25 but there was never going to be enough volume to follow through on that with so few American traders at their desks.

There are a lot of charts showing me that a change might be afoot and, although I never act until I see it confirmed, I'm definitely gearing up for a turnaround. I've mentioned previously that I see USDCAD finally making a good case for strengthening. I also see a potentially big correction ahead for GBPUSD and NZDUSD. My gut feeling is also that we have some big Yen strength heading our way.

This is the fun of the markets though and the intellectual challenge is why I still do it. The old saying "predictions are for weathermen" is true but I always like the try to envisage what's ahead. The key is then to be able to drop my theories like a hot coal when price action shows me I'm plain wrong

Enjoy the holiday TV and all !

O N D
 
 
  • Post #780
  • Quote
  • Nov 22, 2007 11:06am Nov 22, 2007 11:06am
  •  Scooter
  • | Joined May 2004 | Status: Member | 64 Posts
Thanks TV...

So after the retrace you would enter after price breaks down through the yellow line expecting some resistance at the red flag area.....maybe take some profit or just continue to hold depending on what the larger time frames show?

If the price never retraces and shoots straight down then one should take the attitude of "...well that bus left but there will always be another one coming....and not chase it."

I hope I have it right or learning correctly...tired of being the turkey for feast in the slaughter zone. Sorry for the Thanksgiving Day pun but I just couldn't resist!

Scooter.
Still haven't found what I'm looking for...
 
 
  • Trading Systems
  • /
  • The System (Irony included)
  • Reply to Thread
    • 1 3738Page 394041 59
    • 1 38Page 3940 59
0 traders viewing now
  • More
Top of Page
  • Facebook
  • Twitter
About FF
  • Mission
  • Products
  • User Guide
  • Media Kit
  • Blog
  • Contact
FF Products
  • Forums
  • Trades
  • Calendar
  • News
  • Market
  • Brokers
  • Trade Explorer
FF Website
  • Homepage
  • Search
  • Members
  • Report a Bug
Follow FF
  • Facebook
  • Twitter

FF Sister Sites:

  • Metals Mine
  • Energy EXCH
  • Crypto Craft

Forex Factory® is a brand of Fair Economy, Inc.

Terms of Service / ©2023