DislikedFeb,
I placed pending buy order few pips above the fractal (4 hours and daily only) , 4 out of 5 cases it actually came to that point my order got triggered and went right back down http://www.forexfactory.com/images/icons/icon9.gif
Is this what you meant by 'sharks waiting' in your earlier posts?
I want to understand this better.
Am I suppose to wait until a close happens above the Fractal before entering rather than as soon as it clears the fractal. And never to use the pending order
Honestly, I can't thank you enough for strating this thread.
Thanks,
TradeStarIgnored
If you look back at all the "up fractals" for a period of time on a chart, you will no doubt find that a good proportion of those are breached by 5-25 ticks before price retraces again.
Essentially you are simply being a breakout trader if you take the trade based purely on a close above a fractal. Nothing wrong with that in itself but I have found over the years that the percentage of "false breakouts" have gradually increased to such a point that I wouldn't tend to take them on their own.
My big rule is to look at the overall context of the price action and what the market structure looks like up to that point in time. I'll try to explain that more explicitly in a second but first I should clarify that, for me, a candle that hasn't closed yet could end up being anything and I'd usually wait for the close.
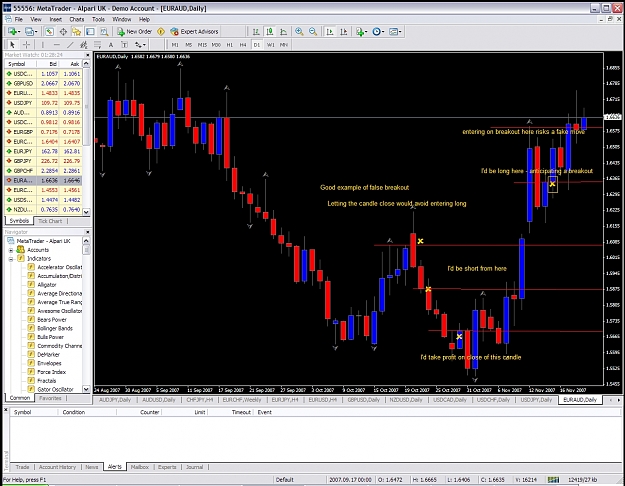
The post you quoted from Feb had him saying that he would probably buy on the bearish bar in the EURAUD example. That is his way of getting in on the direction without paying premium prices. I would probably have waited until the completion of the next daily bar which was bullish and closed fairly strongly. He'd be in quicker and he'd get more profit for that extra risk but what we'd both have in common is that we'd be anticipating that the recent high of 1.6590 ish was going to be broken. Whereas, if you were to wait on it being broken, you'd be buying in at a lot higher price and risking being on the end of a false breakout.
For me, when a key level is broken I am alerted to the fact I might get in. I'd usually want to get in on a retracement or on an exceptionally bullish closed candle.
I'm probably not explaining this very well. What I'll do is annotate a chart and try to attach it as a picture is usually worth a thousand words.
Please forgive me for butting in on a question you've asked of someone else but hopefully this will be of some help to you as I know it can be disheartening to seemingly have a knack for getting in just as price reverses direction against you!