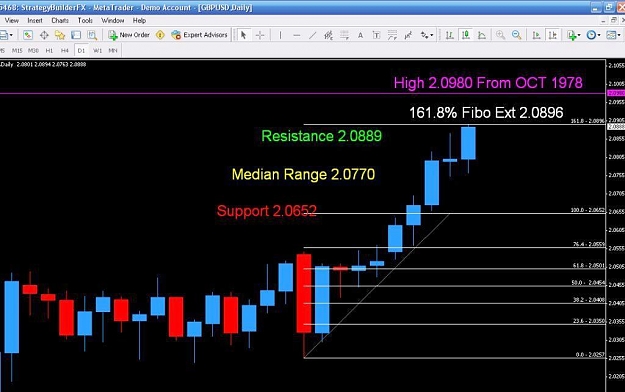
This is the chart of GU DAILY at 3pm EST.
As you can see the price has reached a higher high from the previous chart a few hours ago.
I have place a 161.8% Fibo Extension from the low at 2.0257 up to the Support Line at 2.0652 which was taken from the daily high on 7/24/2007.
We are now within 7 pips of that extension line.
Also looking at an historical high from Oct 1978 at 2.0980 which is only 91 pips higher then our high today.
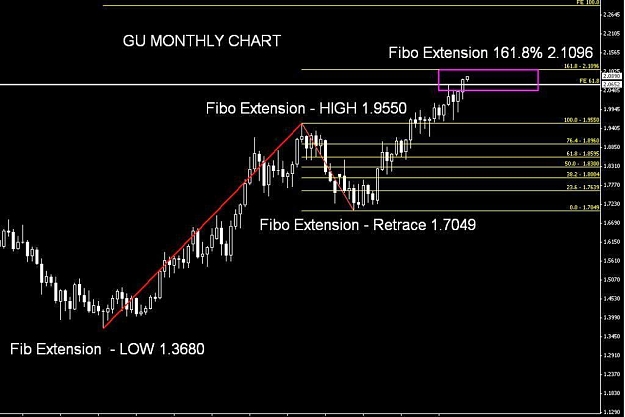
I will add more analysis over the weekend from the Weekly and Monthly.
Ken
UPDATED: 3:40 pm Friday EST
High has reached 2.0894 just 2 pips from the 161.8% Fibo Ext shown in the chart below.
I would think Sunday Open Market would find some cooling off before we see more upwards movement.
As you can see the price has reached a higher high from the previous chart a few hours ago.
I have place a 161.8% Fibo Extension from the low at 2.0257 up to the Support Line at 2.0652 which was taken from the daily high on 7/24/2007.
We are now within 7 pips of that extension line.
Also looking at an historical high from Oct 1978 at 2.0980 which is only 91 pips higher then our high today.
I will add more analysis over the weekend from the Weekly and Monthly.
Ken
UPDATED: 3:40 pm Friday EST
High has reached 2.0894 just 2 pips from the 161.8% Fibo Ext shown in the chart below.
I would think Sunday Open Market would find some cooling off before we see more upwards movement.
Attached Image (click to enlarge)