In post 10,725, RH says "it can take a significant amount of chart viewing time to fully understand the RSO and its many nuances".
Here is one.
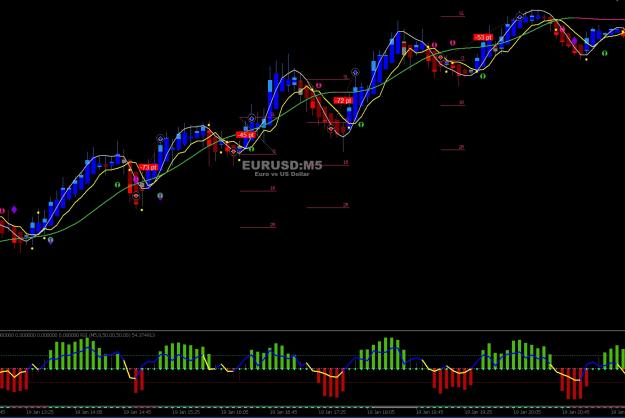
Check the image. There are 3 continuation trades on the M3 timeframe. The first two are profitable; the last one isn't. Why? Let’s look at what the 8-3-3 stochastic on the higher timeframe (M15) is doing at that moment (the 34-10-3 stochastic is hidden for better visibility):
-The 8-3-3 stoch is not following price. What is that called? (posts 9,464 and 9,963)
-The slope of the 8-3-3 stoch is downwards.
-The 8-3-3 stoch is at extreme levels (90 for bullish - 10 for bearish)
Do not blindly enter a continuation trade without checking the higher timeframe.
Here is one.
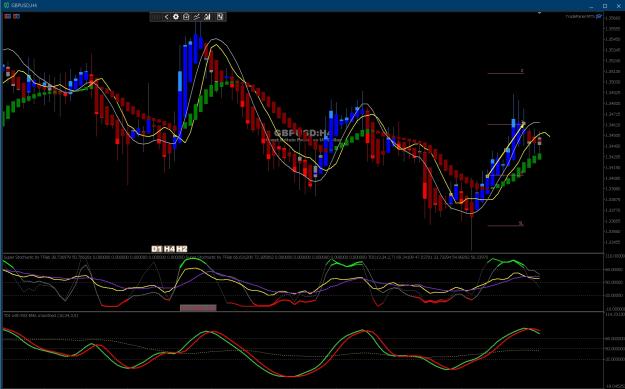
Check the image. There are 3 continuation trades on the M3 timeframe. The first two are profitable; the last one isn't. Why? Let’s look at what the 8-3-3 stochastic on the higher timeframe (M15) is doing at that moment (the 34-10-3 stochastic is hidden for better visibility):
-The 8-3-3 stoch is not following price. What is that called? (posts 9,464 and 9,963)
-The slope of the 8-3-3 stoch is downwards.
-The 8-3-3 stoch is at extreme levels (90 for bullish - 10 for bearish)
Do not blindly enter a continuation trade without checking the higher timeframe.
Attached Image (click to enlarge)

5