• Home
  • Forums
  • Trades
  • News
  • Calendar
  • Market
  • Brokers
  • Login
  • Join
  • User/Email: Password:
  • 10:34am
Menu
  • Forums
  • Trades
  • News
  • Calendar
  • Market
  • Brokers
  • Login
  • Join
  • 10:34am
Sister Sites
  • Metals Mine
  • Energy EXCH
  • Crypto Craft

Options

Bookmark Thread

First Page First Unread Last Page Last Post

Print Thread

Similar Threads

4 HD system (trend follower) 3 replies

Journal for Trend Follower 5 Minute System 9 replies

Trend Follower System Programming 4 replies

A good EA trend follower? 2 replies

trend follower system templates and indicators an issue 5 replies

  • Trading Systems
  • /
  • Reply to Thread
  • Subscribe
  • 849
Attachments: Trend Follower 5 Minute System
Exit Attachments

Trend Follower 5 Minute System

  • Last Post
  •  
  • 1 1819Page 202122 190
  • 1 Page 20 190
  •  
  • Post #381
  • Quote
  • Aug 22, 2007 5:08am Aug 22, 2007 5:08am
  •  james2ko
  • | Joined Apr 2005 | Status: Member | 67 Posts
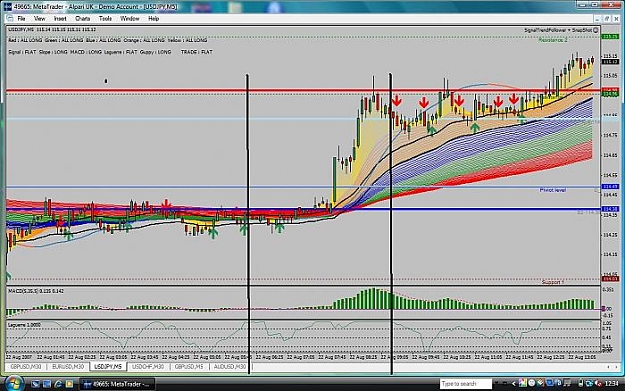
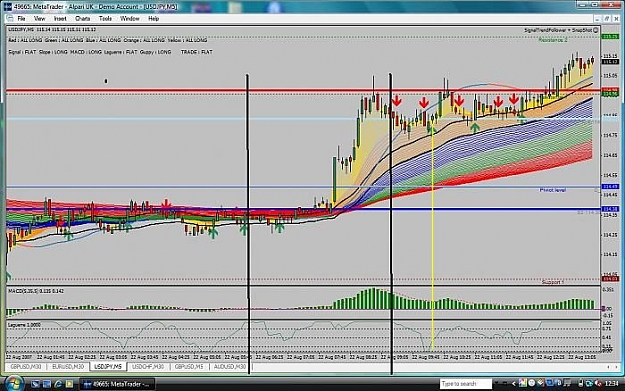
Here's a handy expert I found at another forum called ManageTakeProfit. I attach it immediately after receiving a signal from snapshot. It has effectively managed my trades while I'm away from the computer. Enclosed also are full instructions. Enjoy!
Attached Files
File Type: mq4 MTP1.3.mq4   8 KB | 1,694 download
File Type: doc MTP Advisor4FF.doc   115 KB | 2,191 downloads
  • Post #382
  • Quote
  • Aug 22, 2007 6:04am Aug 22, 2007 6:04am
  •  cesande
  • | Joined Jul 2007 | Status: Member | 599 Posts
I have read all the posts and am watching it perform now while demo trading.
I have heard about 5 and 30 minute time frame users, but wondered if anyone is looking at 15min or maybe 1h.

Just currious.
  • Post #383
  • Quote
  • Aug 22, 2007 7:49am Aug 22, 2007 7:49am
  •  cesande
  • | Joined Jul 2007 | Status: Member | 599 Posts
When looking more at the charts I see these light blue W_P and M_P lines.

They don't have the label on the chart, but when I highlight them I see the W_P and M_P ???

Any help appreciated.

EDIT: looking further, are these Weekly Pivot lines.
  • Post #384
  • Quote
  • Aug 22, 2007 7:57am Aug 22, 2007 7:57am
  •  watchout4me
  • | Joined Jun 2007 | Status: Member | 163 Posts
is there a trade btw these lines?
Attached Image (click to enlarge)
Click to Enlarge

Name: Untitled.jpg
Size: 72 KB
  • Post #385
  • Quote
  • Aug 22, 2007 8:25am Aug 22, 2007 8:25am
  •  FxFocus
  • | Joined Aug 2007 | Status: Member | 55 Posts
Quoting watchout4me
Disliked
is there a trade btw these lines?
Ignored
No, the Laguerre needs to have passed through 0.15 and be pointing north.

Ed.
  • Post #386
  • Quote
  • Aug 22, 2007 8:29am Aug 22, 2007 8:29am
  •  watchout4me
  • | Joined Jun 2007 | Status: Member | 163 Posts
Quoting FxFocus
Disliked
No, the Laguerre needs to have passed through 0.15 and be pointing north.

Ed.
Ignored
ok

thank you.

so entry signals is not always many
  • Post #387
  • Quote
  • Aug 22, 2007 8:40am Aug 22, 2007 8:40am
  •  C.E.O.
  • | Joined Dec 2006 | Status: WTF! | 243 Posts
Quoting watchout4me
Disliked
is there a trade btw these lines?
Ignored
No, the Laguerre has to come up from below 15 for a buy and it never got close. As far as the system goes im a 1 and 5 min chart guy. I had several signals this morning but was just to tired to get up unfortunately. Most of them would have ended up profitable.

My problem is still the missed opportunities on entering into an established trend. Laguerre settings are strong enough to confirm the trend direction but to strong to get back in on a retrace. I hate tearing systems apart but I cant help it. I am using the same indicators and have gotten rid of the EMA crossover. IMHO if the rainbow is there why do you need this, other than a visual cue that they have crossed. I would say if this is used, move the settings to a 3-6 or a 2-5 cross. Laguerre is to strong at .66 and I am looking at .5-.55. MACD I just dont know yet. I actually think it needs to be stronger to keep it on the right side of a trend longer. It has missed several reentried because it has fallen just below 0 so maybe a 5-45 would be better. Again, I think it is a good system but for me I need in more, and a bar or two earlier can make the difference in a win or loss.

Also if a rough EA isnt posted soon I will put in some buy/sell logic to the indicator EA to just get in some backtesting without doing it manually.
  • Post #388
  • Quote
  • Aug 22, 2007 8:47am Aug 22, 2007 8:47am
  •  FxFocus
  • | Joined Aug 2007 | Status: Member | 55 Posts
Quoting watchout4me
Disliked
ok

thank you.

so entry signals is not always many
Ignored
That's right.

For an example of a valid entry signal have a look at the USD/JPY 5 minute chart @ 8:10 GMT this morning.

IMPORTANT:- your chart may be GMT+2 like mine or different.

Hope this helps,
Ed.
  • Post #389
  • Quote
  • Aug 22, 2007 8:58am Aug 22, 2007 8:58am
  •  watchout4me
  • | Joined Jun 2007 | Status: Member | 163 Posts
Quoting FxFocus
Disliked
That's right.

For an example of a valid entry signal have a look at the USD/JPY 5 minute chart @ 8:10 GMT this morning.

IMPORTANT:- your chart may be GMT+2 like mine or different.

Hope this helps,
Ed.
Ignored
FxFocus,

kindly check the screenshot i posted earlier. it's today USD/JPY 5 minute chart.

where is the signal you're talking about?

thanks
  • Post #390
  • Quote
  • Aug 22, 2007 9:38am Aug 22, 2007 9:38am
  •  FxFocus
  • | Joined Aug 2007 | Status: Member | 55 Posts
Quoting watchout4me
Disliked
FxFocus,

kindly check the screenshot i posted earlier. it's today USD/JPY 5 minute chart.

where is the signal you're talking about?

thanks
Ignored

Sorry, did not notice it was the same chart.

See yellow line I have drawn on your chart....
Attached Image (click to enlarge)
Click to Enlarge

Name: Image1.jpg
Size: 76 KB
  • Post #391
  • Quote
  • Aug 22, 2007 9:48am Aug 22, 2007 9:48am
  •  watchout4me
  • | Joined Jun 2007 | Status: Member | 163 Posts
Quoting FxFocus
Disliked
Sorry, did not notice it was the same chart.

See yellow line I have drawn on your chart....
Ignored
thank you.

when or where do you exit
  • Post #392
  • Quote
  • Aug 22, 2007 10:25am Aug 22, 2007 10:25am
  •  FxFocus
  • | Joined Aug 2007 | Status: Member | 55 Posts
Quoting watchout4me
Disliked
thank you.

when or where do you exit
Ignored

Good question...


I took that trade @ 114.83 and got out at the first resistance line showing on the chart @ 114.96 and so made a fast 13 pips. (spread allowed for).

But if I had followed authors advice (TheWicker) and opened two positions with the 2nd targeting the next resistance @ 115.24 and upon reaching the first target took profit on the first position and at the same time set SL on 2nd position to break even, then we see (with the benifit of hindsight) I would have made further 41 pips on the second position.

The downside of taking two positions is doubling your losses when both are stopped out.

Ed.
  • Post #393
  • Quote
  • Aug 22, 2007 10:59am Aug 22, 2007 10:59am
  •  censura
  • | Joined Sep 2006 | Status: Member | 405 Posts
Quoting JimCrossley
Disliked
Hi all. I have been following this thread since the inception. Many thanks to TheWicker and all of the contributors thus far to this thread. And now it is my turn to contribute.

As a trader; the system has a good foundation. And I do like the usability of the indicators; except for just one. The Rainbow; yes the foundation. I have made a small change to the Rainbow indicator so you can hide it or show it very easily.

One might ask why I or you might need to do this. I am very big into Fibs and I often have 3 or 4 sets of Fib lines on one chart. Two on the left and two on the right of the current bar or candle. And then there are my trend lines I draw and the multi-timeframe pivot points.

My charts can get very cluttered/busy and I can not read or see every thing I need to see. Now that I have vented and probably described what most of you experience all of the time on your charts, you will know why I made this change.

The original indicator was posted way back at the beginning of the thread. When I first installed the indicators; all 11 of them, I change the colors to come close to what TheWicker described.

Since then, the only change I have made was to add a very basic on off switch that you control with F3 on your key board. Here is how it works. When you press F3 the Global Variables window appears. This is the foundation for the switch. Press the Add button and enter in the Variable column the name HideRainbow and enter 1 into the Value column. This will turn off all of the rainbow elements when you close the window F3 window. If you are at the 5M chart, switch to the any other time frame and come back to the 5M and you will see the Rainbow is gone. It will not show again on any chart until you change the value of 1 to some thing else or remove the HideRainbow entry.

This solution should save you having to run multiple templates; which when loaded blows away any existing trend lines, notes or Fib lines you may have on your chart.

I added the following lines of code to each of the 11 indicators.


if (GlobalVariableCheck("HideRainbow")){
double show;
show = GlobalVariableGet("HideRainbow");
if (show == 1.0) return(0);
}


The indicators are attached to this post.

I hope you find this technique useful in the future with other indicators you acquire or develop your self.

Unless the code will not work as outlined above, I in no way will make any other changes to this source code. It is up to you.

Thanks again to every one on the thread. Good luck to you all on finding the "Pot of Gold" at the end of the rainbow.
Ignored
tried it but could not get it to work , checcked code it is there add varible even copied and pasted the text from code no joy?
  • Post #394
  • Quote
  • Aug 22, 2007 12:00pm Aug 22, 2007 12:00pm
  •  censura
  • | Joined Sep 2006 | Status: Member | 405 Posts
sorry it did work as you say need to switch timeframes to see it work thank you
  • Post #395
  • Quote
  • Aug 22, 2007 1:05pm Aug 22, 2007 1:05pm
  •  cesande
  • | Joined Jul 2007 | Status: Member | 599 Posts
Anyone see the EURJPY signal NOW!

Is this a valid signal?

Only thing I see is the slope direction flat and red???
  • Post #396
  • Quote
  • Aug 22, 2007 1:06pm Aug 22, 2007 1:06pm
  •  cesande
  • | Joined Jul 2007 | Status: Member | 599 Posts
What about the signal just given for the GBPUSD?
  • Post #397
  • Quote
  • Aug 22, 2007 1:28pm Aug 22, 2007 1:28pm
  •  cesande
  • | Joined Jul 2007 | Status: Member | 599 Posts
I see several opportunities (at least I thinnk I do).
Can anyone tell me how to best post chart pictures?
I have several posts, but no chart examples uploaded.

Thanks
  • Post #398
  • Quote
  • Aug 22, 2007 1:32pm Aug 22, 2007 1:32pm
  •  billbss
  • Joined Apr 2006 | Status: Member | 4,301 Posts
Quoting cesande
Disliked
I see several opportunities (at least I thinnk I do).
Can anyone tell me how to best post chart pictures?
I have several posts, but no chart examples uploaded.

Thanks
Ignored
Do you know how to take a screenshot of your chart?
  • Post #399
  • Quote
  • Aug 22, 2007 1:34pm Aug 22, 2007 1:34pm
  •  cesande
  • | Joined Jul 2007 | Status: Member | 599 Posts
I can print screen adn then dump it into paint and cut out the portion I am looking at.

Do you have another way?

edit: I have also used Gadwin in the past to capture screen shots.
  • Post #400
  • Quote
  • Aug 22, 2007 1:42pm Aug 22, 2007 1:42pm
  •  billbss
  • Joined Apr 2006 | Status: Member | 4,301 Posts
Quoting cesande
Disliked
I can print screen adn then dump it into paint and cut out the portion I am looking at.

Do you have another way?

edit: I have also used Gadwin in the past to capture screen shots.
Ignored
Easy way is to go to "File" on your MT4.
Then "Save as picture"
Name it and save it- poke around and you'll see how to do it.

When you have it named and saved.
Come here like you were going to post. Scroll down below the window you write in. You'll see a button named "manage attachments"
Click it.
Then Browse until you find your saved screenshot in your computer and click "upload"

That'll do it.
  • Trading Systems
  • /
  • Trend Follower 5 Minute System
  • Reply to Thread
    • 1 1819Page 202122 190
    • 1 Page 20 190
0 traders viewing now
  • More
Top of Page
  • Facebook
  • Twitter
About FF
  • Mission
  • Products
  • User Guide
  • Media Kit
  • Blog
  • Contact
FF Products
  • Forums
  • Trades
  • Calendar
  • News
  • Market
  • Brokers
  • Trade Explorer
FF Website
  • Homepage
  • Search
  • Members
  • Report a Bug
Follow FF
  • Facebook
  • Twitter

FF Sister Sites:

  • Metals Mine
  • Energy EXCH
  • Crypto Craft

Forex Factory® is a brand of Fair Economy, Inc.

Terms of Service / ©2021