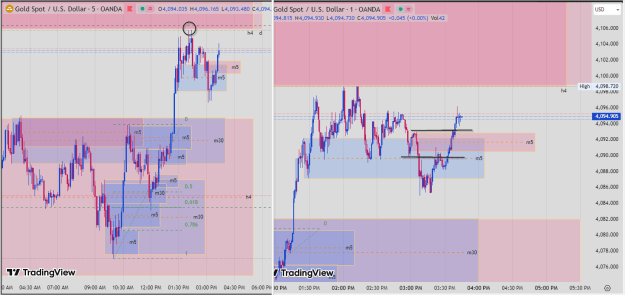
Disliked{quote} we come down to a small time frame, reading the m5 price action. i am using engulfing and riverbank pattern to read price action. we all know that there is no such thing as 100%. but these come close enough for me. from a tested bullish engulf to bearish engulf move. we are in a bearish h4 engulf, yet why price is moving up? more lower time frames than m5 explanaton coming later. {image}Ignored
it took years for me to understand, so i do not expect traders to understand in just a couple of months unless you already had knowledge of it previously.
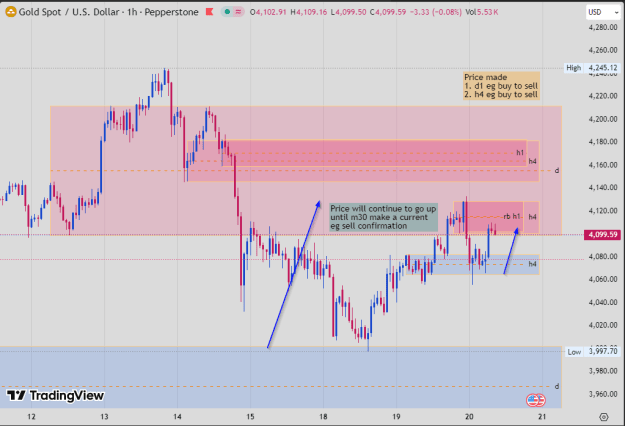
we are in a h4 bearish engulf, yet why price is moving up?
today i mentioned a few posts earlier about road block, remember?
now m30 bullish engulf is the road block within the h4 bearish engulf.
also price had been going up since yesterday, possible that tuesday could be the low of this week.
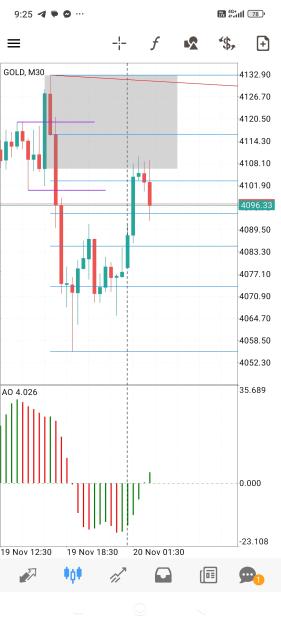
within m30 bullish engulf, there appeared a tested m5 bullish engulf aligning with it. both bullish engulf.
we also see that previously the m5 bearish engulf within the m30 bearish engulf prevented the move up.
so this was both a m30 eg buy to m30 eg sell, also a m5 eg buy to m5 eg sell move.
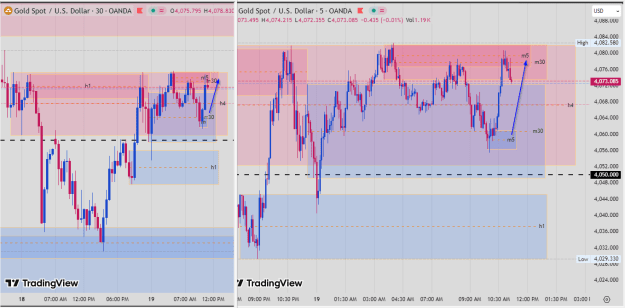
going lower than m5, both the m3/m1 showed the eg buy/eg sell fail build up like stairs going up.
further more we can also see the riverbank confirmation in m3/m1.
trading engulfing is like analysing from the higher time frames down to the lower.
at the beginning of the week, look at w1 engulf. then move 1 or 2 time frames lower to see any road blocks or alignments with w1 engulf.
at the beginning of the day, from d1 engulf move down 1 or 2 time frames lower.
at the beginning of a market session, from h4 engulf move down 1 or 2 time frames lower. and so on until your entry time frame ...... all the while knowing where are the road blocks or alignments.
Attached Image(s) (click to enlarge)

ITB - Seeing Orderliness amongst 'Randomness'
1