I am a beginner to forex trading and I've seen this statement made.
Say you think that the currency will move in a particular direction - i see quite often about if price breaks such and such level then go short, or go long.
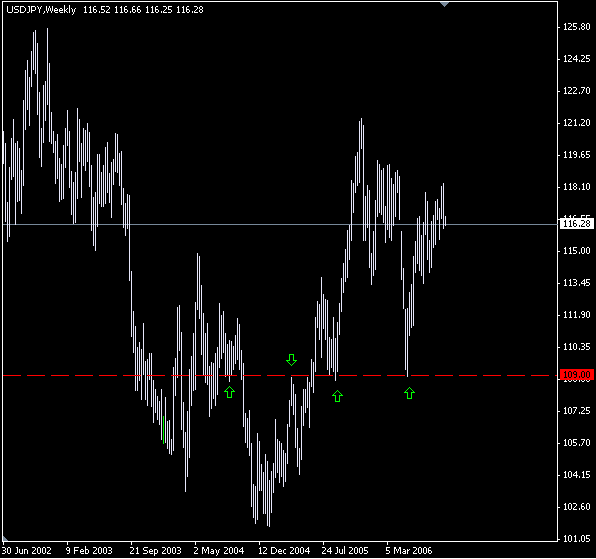
This is based upon support and resistance right?
But what is the significance of the level? It seems as if it's a type of confirmation, but I wonder if it breaks by 1 pip and then reverses you get stopped out maybe.
To use this there must be a statistical correlation between the break and the
expected direction, surely we should know what that is, or doesn't it matter?
I'm just trying to get my head around it, fully that's all.
Thanks if you have any ideas or stable info on this.
Say you think that the currency will move in a particular direction - i see quite often about if price breaks such and such level then go short, or go long.
This is based upon support and resistance right?
But what is the significance of the level? It seems as if it's a type of confirmation, but I wonder if it breaks by 1 pip and then reverses you get stopped out maybe.
To use this there must be a statistical correlation between the break and the
expected direction, surely we should know what that is, or doesn't it matter?
I'm just trying to get my head around it, fully that's all.
Thanks if you have any ideas or stable info on this.