Tick Charts
https://www.google.com/search?q=tick...kJCQapnGg,st:0
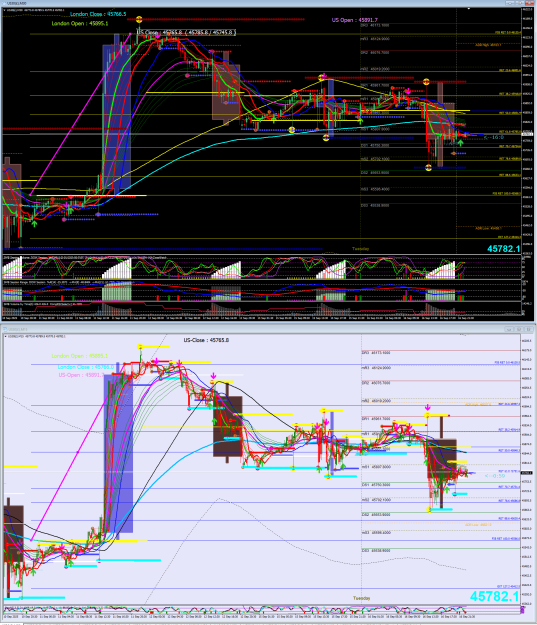
The utility of the tick chart (the display on the number of trades, not the size of trades) is still useful, but do not be deceived by equalling the number of trades with the size (number of contracts/shares which truly represents volume. In that sense a true volume even if achievable on indices is a very complex and demands expansive data feed which is more accurate but not perfect
Attachment g
Pleas note that Finviz (bottom chart) displays only NYSE session
Possibly useful though basic explanation
https://thesecretmindset.com/tick-charts/
Tick chart the way I have been using is very basic, let say 500 tick per candle chart displays congestion and M5 to M15 is in an ares/zone of interest, than I reed it as a possibility of entry/exit This is not a prefect and exact art, but it seems to be useful during the active NYSE session
I know that this post is a diversion from what some would consider VSA, though the most basic VSA is to observe tick against the real volume of the exact number of counteracts/shares of the given security.
In the end one has to work with what is available, taking into account that retail traders face many natural disadvantages, and advantages too.
Whatever one does make sure that the scale is tipped in our favour!!! - Being consistently profitable.
https://www.google.com/search?q=tick...kJCQapnGg,st:0
The utility of the tick chart (the display on the number of trades, not the size of trades) is still useful, but do not be deceived by equalling the number of trades with the size (number of contracts/shares which truly represents volume. In that sense a true volume even if achievable on indices is a very complex and demands expansive data feed which is more accurate but not perfect
Attachment g
Pleas note that Finviz (bottom chart) displays only NYSE session
Possibly useful though basic explanation
https://thesecretmindset.com/tick-charts/
Tick chart the way I have been using is very basic, let say 500 tick per candle chart displays congestion and M5 to M15 is in an ares/zone of interest, than I reed it as a possibility of entry/exit This is not a prefect and exact art, but it seems to be useful during the active NYSE session
I know that this post is a diversion from what some would consider VSA, though the most basic VSA is to observe tick against the real volume of the exact number of counteracts/shares of the given security.
In the end one has to work with what is available, taking into account that retail traders face many natural disadvantages, and advantages too.
Whatever one does make sure that the scale is tipped in our favour!!! - Being consistently profitable.
Make sure losses are small and profits are bigger!