Isn't Everyday just as good to make some money ?
----------------------------------------------------------
NFP Report = Increased volatility trading ?
Isn't Everyday just as good to make some money ?
----------------------------------------------------------
NFP Report = Increased volatility trading ?
Quick question
----------------------------------------------------------
Your chart has bullish posture , just above
.............. is this correct ?
Ignored
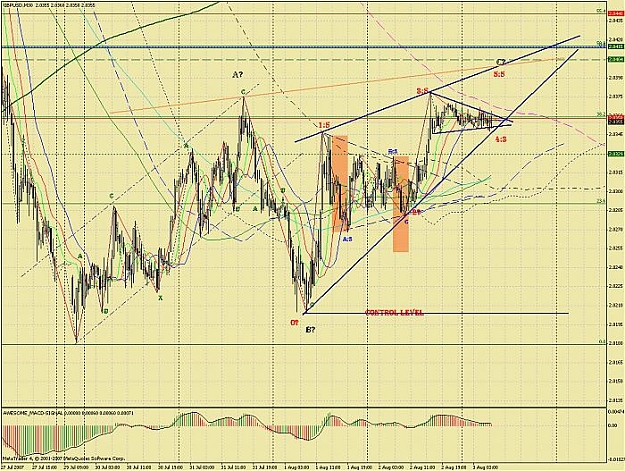
the chart GBPUSD shows that we are in the wave C which can be subdivided into 5 waves. I am going to sell on american data (nonfarm) when the fifhe wave will be formed. By the way,I meant that today we can see high volatility
that's right africanpip. actually it's my alternative count, a failure 5th wave.
but until gbpusd break up 2.0420 (my red horizotal line), i won't change my count yet. at least for this moment
hey, can u post some chart? it will help a lot, thanks...
Ignored
Sure here you go.....sorry a bit late.
Attached Image (click to enlarge)
Eish!
If you don't fly with the eagles you'll scratch with the turkeys
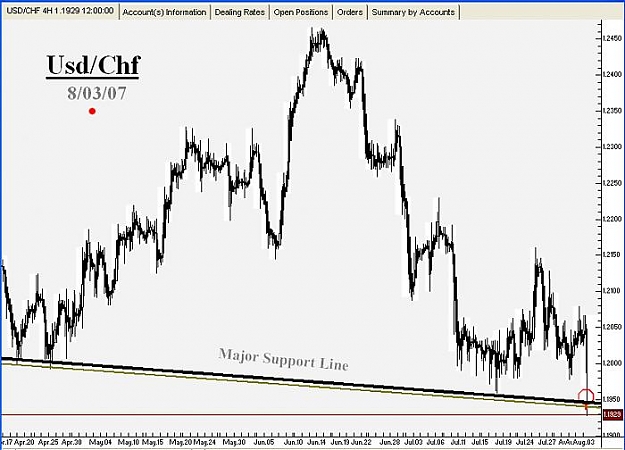
Been shorting it a bit lately =)
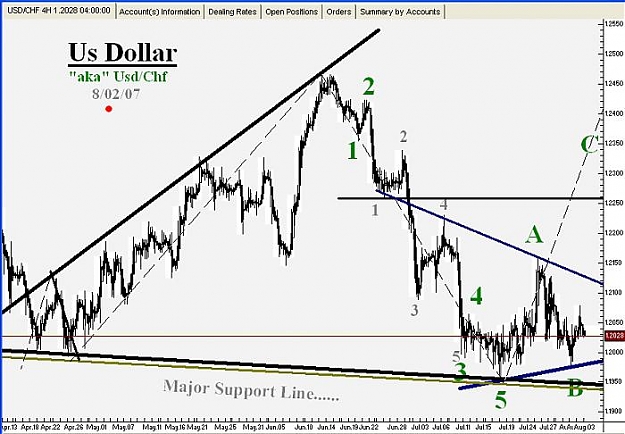
Confirmation for this last push was loss of 1.2020 for me with 1.1930 first s/r as .618 of wave three for 5 I think? Not sure. Around 233 pips off the top of this wave 5 down, also a nice fib nr
P.S. USDX is still above key 80.00, trading at 80.28 right now which is higher than the last low on the 24th July which was 80.02. USDCHF is not equal to the USD per se
congrats for the trade SL. nice pips... :
marketwavez, can u post cable chart pls? just curious with ur counts on this one. so far now i agree with africanpip chart.
I am happy to note that there has been an increased level of activity in this thread even though I was not around most of the time.
I was busy with my other business that needed a bundle of things to take care of. Anyway, my last post at post 165 remains basically my position till we finish what I see as a Wave 5 UP. You can go back to post 149 and 152 for my charts.
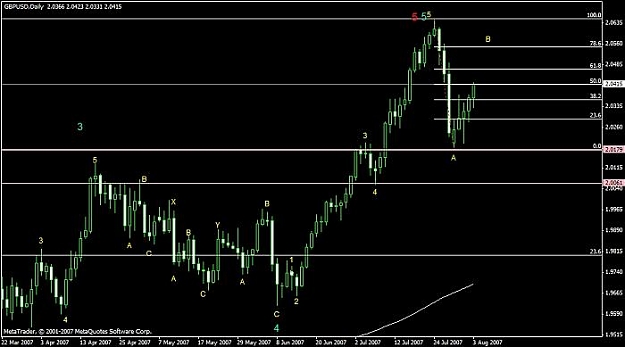
I will maintain that we finished Wave 4 down at 2.0181 and that we are currently in the Wave 5 Up now. This view will only change if we go lower than 2.0181 from were we are right now.
There are a number of reasons why I think we are in a wave 5 up now from 2.0181.
1. from wave 3 @ 2.0652 A retracement for Wave 4 is allowed till the tip of Wave 1 @ 2.0206. It was surpassed though . But think it was with in the tolerance range.
2. 2.0181 was within the vicinity range of a 161.8% of Wave A:4 projection for Wave C:4.
I do not see price going lower than 2.0181 now until we finish Wave 5 or M3.3.5.3.3.5. This puts us at the end of the next higher wave degree Wave 3 or M3.3.5.3.3 We would then expect a Wave 4 to come down to below 2.0000 up to 1.9600 as retracement from Wave 3.
My current objectives for Wave 5 in this Impulse Wave up we are in right now would be :
2.0543
2.0768
2.1000
2.1200
Please note that my projection levels are just my own projections. They may seem too high for many of you out there. I believe that I can take these positions as a swing trader. Remember that there will be so many ups and downs before we reach the levels I think that this GBPUSD Pair will reach.
I started a new demo account for this since we hit the 2.0181
my account has increased by 23.4%. I was not able to maximize earnings on this initial phase of Wave 5 because I was not often on my computer. There were days I would be at a negative 78pips. BUt I held on thinking that it will come back up again as thisis a Wave 5. As of Early Saturday morning, I already exited all my trades thinking I could enter at a lower level and ride this Wave 5 up again. I exited to early and missed around 45 additional pips. But that is ok. price is a little lower than were I exited last Saturday here in Asia. I can eneter a long again for probably a TP of almost 20-30 pips before it comes down again for a Wave 4 within the Wave 3 of this Big Wave 5 up.
Or I can let it go up for awhile and wait till it retraces for that small wave 4 then I can hop in again for the continued ride UP.
hhhmmmmm I hope I did not lose anybody out there on that circle of waves within waves.
Looks like my counts differ from that of Serega, Bohebolo and Africanpips. I am not saying I am right and you are wrong. Just aknowledging the differences in our counts.
It seems that mine is same as that of SeekingLight.
Marketwaves' Weekly chart seem to be heading the same way UP. Note that his DAily Chart shows Price overshooting that Diagonal triangle UP.
|
Joined Sep 2006
|
Status: just another tough day in Africa
|204 Posts
Hey EG, I hope you don't mind me taking up this space but as you say if we can all learn together, in a positive learning environment, then all the better for us.
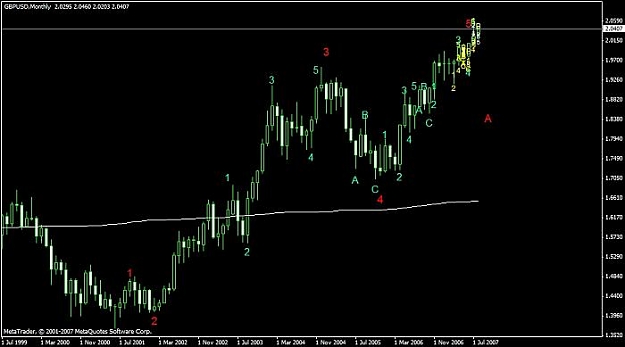
Well I have done this Vertical Analysis of some of the more significant charts for Cable. The Analysis starts on the Monthly then down to the 4h chart.
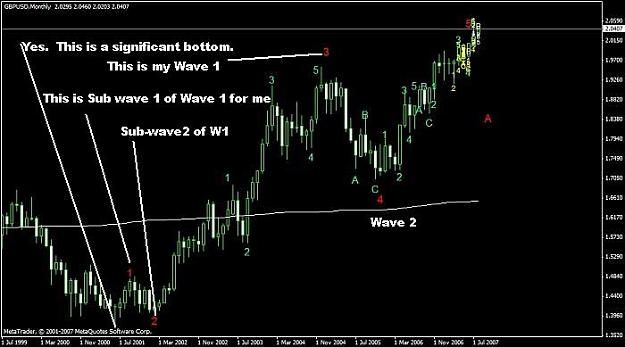
The monthly is a little congested at the top but I think you can get my wave count. I believe I have started at a significant bottom.
On the monthly I believe we are in/on wave 5 or at its top, but not too worried about it as the smaller time frames are of more significance. I have gone to the Monthly as part of the big picture or framework to guide the smaller time frames more accurately.
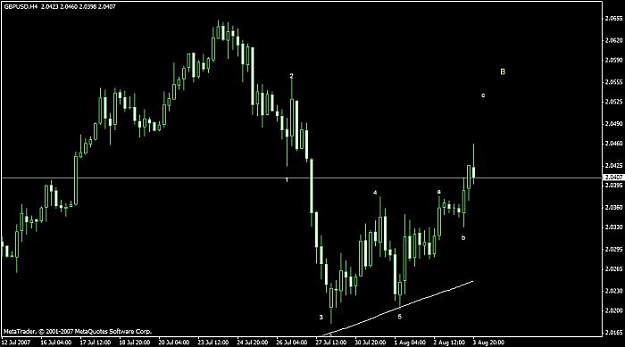
I will post my weekly, daily and 4h charts in separate posts (easier to scroll than open up files all the time)
So this is my Monthly chart (numbers in red).....see if you agree. the rest follow.
Attached Image (click to enlarge)
Eish!
If you don't fly with the eagles you'll scratch with the turkeys
Hey Africanpip. No problem. I actually appreciate everyones effort to post their chart so we can discuss them.
A note to those who will post their charts. I suggest you do like I and africanpip do. We post the charts on successive posts with 1 chart per post. Otherwise, we would still have to open each chart separately.
Africanpip is right. It is much easier to view them as we just have to scroll and not have to open charts on separate windows still. Just make sure that they are 600x600 in size. Or atleast we would not have to scroll sideways.
Clusterwise.. Thank you for your charts too. Kindly post them on 2 successive posts so they will be esier to view.
Now back to africanpip..... I believe that that is the way to do it. you first start with the monthly chart then move down to establish your counts. But as you stay on the shorter timeframe charts longer, do not also forget to keep an eye on the development in the higher timeframe charts.
As to your count, I think, the reason why we differ started with our Wave 1 on the monthly chart. Your wave 1 is actually just my sub wave 1 of my bigger wave 3. My Wave 1 is already your Red Wave 3. This is probably the reason why The 2.0652 top is your Wave 5 in that bigger wave degree.
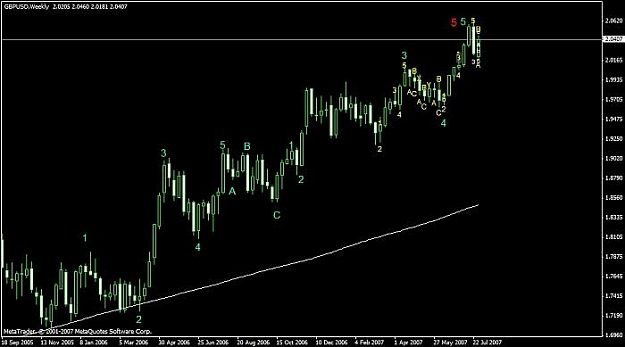
Weekly Chart:
Please check your weekly chart. Your wave 1 seems to defy an impulse wave condition. It looks more like a zigzag. I would move that wave 1 count down and also that wave 2. Then consider what you labelled as wave 1 and 2 to be the sub wave 1 and 2 of a Wave 3.
This is just my opinion. Just pointing out where we differ and why. By the way.... is that an ema on your chart? If it is.... doesn't its direction going up tell us that trend is going up and that this will dispute a view that price is expected to go down at this point?
It would be good to see how others see this positions too.
Clusterwise:
I expect price to come down at Mondays opening but not to the level you expect to see it. This would be my sub wave4 inside a wave 3 in this wave 5 up. Price will probably get down to 2.0310-350 before it continues its way up.
Please note that I am just explaining my position and it does not mean that I am right. I am glad to see you all post your counts. Others will be able to learn from all of us. And I will also be able to learn from you all.
Hey Africanpip. No problem. I actually appreciate everyones effort to post their chart so we can discuss them.
A note to those who will post their charts. I suggest you do like I and africanpip do. We post the charts on successive posts with 1 chart per post. Otherwise, we would still have to open each chart separately.
Africanpip is right. It is much easier to view them as we just have to scroll and not have to open charts on separate windows still. Just make sure that they are 600x600 in size. Or atleast we would not have to scroll sideways.
Clusterwise.. Thank you for your charts too. Kindly post them on 2 successive posts so they will be esier to view.
Now back to africanpip..... I believe that that is the way to do it. you first start with the monthly chart then move down to establish your counts. But as you stay on the shorter timeframe charts longer, do not also forget to keep an eye on the development in the higher timeframe charts.
As to your count, I think, the reason why we differ started with our Wave 1 on the monthly chart. Your wave 1 is actually just my sub wave 1 of my bigger wave 3. My Wave 1 is already your Red Wave 3. This is probably the reason why The 2.0652 top is your Wave 5 in that bigger wave degree.
Weekly Chart:
Please check your weekly chart. Your wave 1 seems to defy an impulse wave condition. It looks more like a zigzag. I would move that wave 1 count down and also that wave 2. Then consider what you labelled as wave 1 and 2 to be the sub wave 1 and 2 of a Wave 3.
This is just my opinion. Just pointing out where we differ and why. By the way.... is that an ema on your chart? If it is.... doesn't its direction going up tell us that trend is going up and that this will dispute a view that price is expected to go down at this point?
It would be good to see how others see this positions too.
Clusterwise:
I expect price to come down at Mondays opening but not to the level you expect to see it. This would be my sub wave4 inside a wave 3 in this wave 5 up. Price will probably get down to 2.0310-350 before it continues its way up.
Please note that I am just explaining my position and it does not mean that I am right. I am glad to see you all post your counts. Others will be able to learn from all of us. And I will also be able to learn from you all.
EG
Ignored
Sorry for inconviniance, I have modified my previous post.
Dear el grande, the target mentioned is the least target I expect, I am expecting that GBPUSD will go beyond that and break major supports.
Is there any of you use Nelly method in analysing the waves ???
Hey Africanpip. No problem. I actually appreciate everyones effort to post their chart so we can discuss
As to your count, I think, the reason why we differ started with our Wave 1 on the monthly chart. Your wave 1 is actually just my sub wave 1 of my bigger wave 3. My Wave 1 is already your Red Wave 3. This is probably the reason why The 2.0652 top is your Wave 5 in that bigger wave degree.
Weekly Chart:
Please check your weekly chart. Your wave 1 seems to defy an impulse wave condition. It looks more like a zigzag. I would move that wave 1 count down and also that wave 2. Then consider what you labelled as wave 1 and 2 to be the sub wave 1 and 2 of a Wave 3.
This is just my opinion. Just pointing out where we differ and why. By the way.... is that an ema on your chart? If it is.... doesn't its direction going up tell us that trend is going up and that this will dispute a view that price is expected to go down at this point?
EG
Ignored
Thanks EG,
In terms of monthly I just feel where I started was a significant bottom, the only other starting point, below that could have been in 1985 (mt4) which I think is too long ago.
On the weekly I am not sure which number 1 you are refering to.
That is a 200 sma on the chart. I use it just as confirmation of the major trends. The monthly is a bit flat. other than they are all pointing up (except the hourly). Above sma long term bullish, below sma bearish. I use mainly 4hr and daily though, that's why I still think (4hr and daily) we are up on wave b. I think we will touch the 61.8% on the daily before dropping. (won't happen now because I said it would )
Anyway I hope you and everyone are able to ge some pips this week and if the count changes then I hope we can spot the change early and take advantage.
Eish!
If you don't fly with the eagles you'll scratch with the turkeys
monthly chart on gbpusd
Yes. I considered that as a significant low too to start with. However, our difference is that (referring to your RED numbers ) your red Wave 1 is only a subwave 1 for me. My wave 1 for that stretch is @ your Red Wave 3.
Your Red wave 2 is only my subwave 2 of my Wave 1 of 1 higher degree. Your RED wave 4 is my Wave 2.
Weekly chart:
I was referring to how your first Blue Wave 1 near the EMA line.