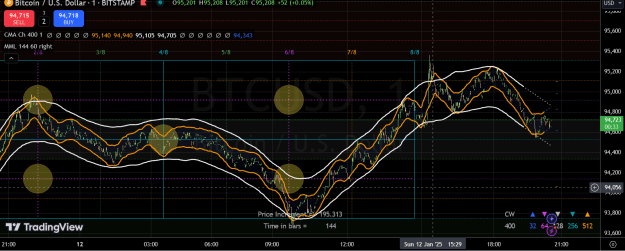
DislikedThe oblique of down pressure remains. {image} {image} 3H BTCEUR_Binance {image}Ignored
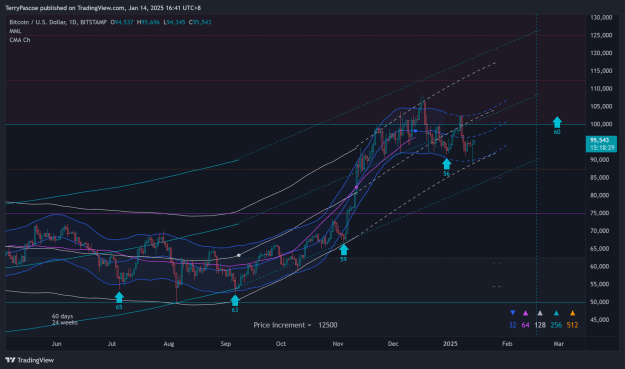
- #14,445
- Edited Jan 13, 2025 1:54am Jan 12, 2025 6:34am | Edited Jan 13, 2025 1:54am
- Joined Oct 2017 | Status: Trader | 12,472 Posts
Planetary cycles, astrological theory of cycles of the markets 510 replies
Forecast Forex using Numeric Cycles and Astrology Cycles 38 replies
Planetary Cycles... Plotting Cycles into the Future 0 replies
Market Waves are NOT Cycles 8 replies
Waves/Trends/Cycles 0 replies
Disliked{quote} Hi Alain, these predictions are for the location of the centre of the candle (hl2). Unfortunately I have no way to determine where the cma will be that far outIgnored
Disliked{quote} Hi Terry Happy New Year P. N. (Pete) Haurlan was the first to use exponential smoothing for tracking stock prices. Haurlan was an actual rocket scientist who worked for JPL in the early 1960s, and thus he had access to a computer. He did not call them “exponential moving averages (EMAs)”, or the mathematically fashionable “exponentially weighted moving averages (EWMAs)”. Instead he called them “Trend Values”, and referred to them by their smoothing constants. Thus, what today is commonly called a 19-day EMA, he called a “10% Trend”. Haurlan...Ignored
DislikedThis new indicator is the McClellan Oscillator as described in Alain’s earlier post. It’s normally coded to represent price fluctuations but I’ve coded it to represent the movements of each of the CMAs instead.( ie MO CMA ) You’ll note it moves into positive (green) territory & negative (red) territory at the same time as the CMA it represents changes direction. If the MO CMA is a large distance from the zero line then it is impossible for the CMA to change direction. It can be used to predict CMA direction changes well before the CMA changes direction...Ignored
Disliked{quote} Hi Terry, I have followed this thread regularly, but not so much now. I do still have an interest in the contents of this thread, but I use MT4 & MT5 chart & find it difficult to match up the CMA's using these charts. I would like to know if you don't mind sharing what the line numbers are on this particular chart. Are they 256, 128, 64, & 32 CMA's? I have found some use in displaced moving averages such as 199, 99, & 49 displaced @ minus 1/2 of the EMS's. Those displaced MAs seem to mimic what I see in this chart. I do admire your work...Ignored
Disliked{quote} Hey Acetrader, hope you don't mind me chimin in - Yes, the numbers for the CMAs in terrys indicator are as you suspect and also including the 512 period line. In regards to choosing the lengths for displaced moving averages, you may be interested in this part of the thread from Parisboy: https://www.forexfactory.com/thread/...2#post10688892 I've avidly read this thread (though I commented very littly respectively), I'll attepmt to summate: The time periods you use are " linked by Harmonics in time 8 / 16 / 32 / 64 / 128...Ignored
Disliked{quote} Hi Ace, the CMA's I'm using are based on harmonics 32, 64, 128, 256 and 512. You can see there directions on the bottom right of the chart. I have experimented with other lengths but don't think it makes any difference to the results. Good luck with your trades.Ignored
Disliked{quote} Hey Acetrader, hope you don't mind me chimin in - Yes, the numbers for the CMAs in terrys indicator are as you suspect and also including the 512 period line. In regards to choosing the lengths for displaced moving averages, you may be interested in this part of the thread from Parisboy: https://www.forexfactory.com/thread/...2#post10688892 I've avidly read this thread (though I commented very littly respectively), I'll attepmt to summate: The time periods you use are " linked by Harmonics in time 8 / 16 / 32 / 64 / 128...Ignored
Disliked{quote} I've avidly read this thread (though I commented very littly respectively), I'll attepmt to summate: The time periods you use are " linked by Harmonics in time 8 / 16 / 32 / 64 / 128...Ignored
Disliked{quote} Hey Acetrader, Yes, the numbers for the CMAs in terrys indicator are as you suspect and also including the 512 period line. In regards to choosing the lengths for displaced moving averages, you may be interested in this part of the thread from Parisboy: https://www.forexfactory.com/thread/...2#post10688892 , I'll attepmt to summate: The time periods you use are " linked by Harmonics in time 8 / 16 / 32 / 64 / 128 / 256 etc divisible by 8 (as price)" !Ignored
Disliked{quote} We are not working with Timeframes but with Bars The CMA's you use averages and smooths a certain number of Bars. The CMA Span (or Period) Hence you need a certain number of Data to generate your CMA To generate the First point of a CMA 512 , you need at least 513 Data - 2 years in Daily. Then using weekly Data 513 Weeks = 10 Years to generate this first CMA point. Then I use 13, 39, 78, 156 and 312 parameters in weeklyIgnored