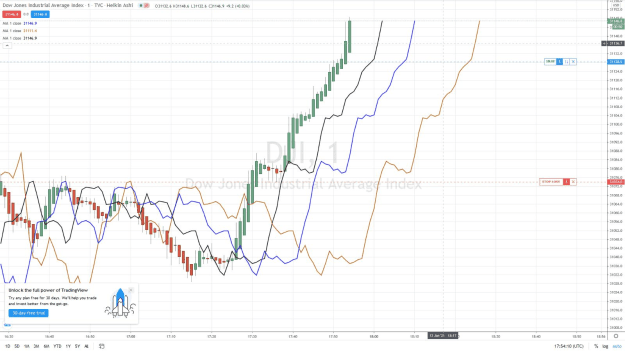
In fact I used FLD's to confirm a Change in direction of the Trend
This role is now played by Terry's CMA indicator which indicates with its white dot when a CMA has made its Top or its Low and will change Direction.
And this by construction at exactly the same Time when the Price Bar will cross its FLD.
Why ?
Because by construction (see Understanding the FLD - Cyclitec Course - Chapter 9)
When the CMA makes its top Price is 1/2 Period away from this Top., then crosses its corresponding FLD which is Price Translated on the Right of 1/2 Period
In the present chart I used a FLD 8 (Black - Price translated 4 Bars on the right)
and a FLD 16 ( blue - Price translated 8 bars on the right)
Then when CMA 8 made its top Price was 4 Bars away from CMA 8 Top
when CMA 16 made its top Price was 8 Bars away from CMA 16 Top
Attached Image (click to enlarge)

3