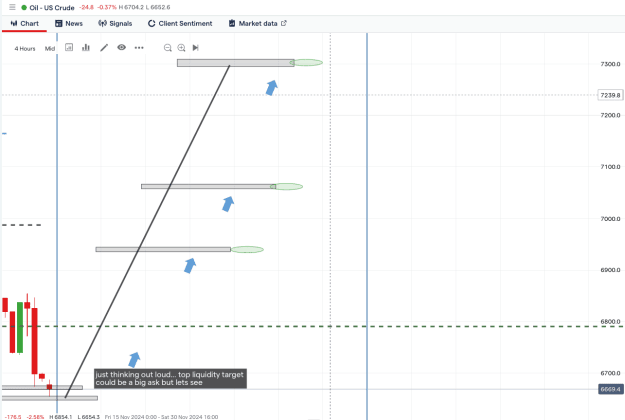
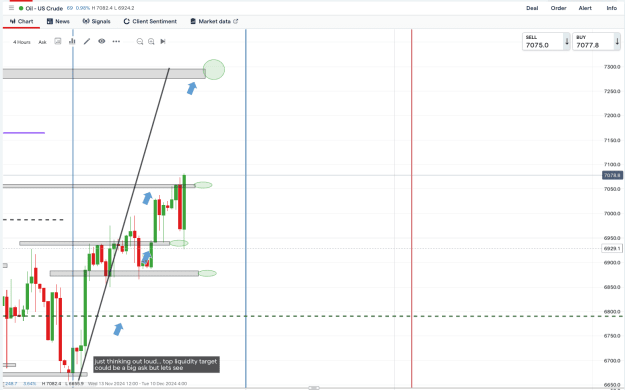
{quote} Oil Update ........ Patience pays even if it is eventually {image} {image}
Ignored
I don't know how you find the extreme target so early. there is one little last red candle and before that there is a giant red candle which tells me bearish continuation and yet you have a arrow pointing all the way up. lol. wtf. I assume you are treating those little candles as exhaustion.
{quote} You are great at getting targets done! Congrats!
Ignored
Price always draws to liquidity zones so pretty easy to find targets the trick is have the patience to hold..... takes a loada time to acquire that patience... explained how to find them on a few of my Skype sessions... if you are on telegram let me know and i can send you the recording
{quote} I don't know how you find the extreme target so early. there is one little last red candle and before that there is a giant red candle which tells me bearish continuation and yet you have a arrow pointing all the way up. lol. wtf. I assume you are treating those little candles as exhaustion.
Ignored
I do get plenty trades wrong... and im not trying to boast.... i get my ass kicked like everyone else from time to time but if the pair im trading goes Titsup im good at GTFO (gettingthefuckout)
{quote} Price always draws to liquidity zones so pretty easy to find targets the trick is have the patience to hold..... takes a loada time to acquire that patience... explained how to find them on a few of my Skype sessions... if you are on telegram let me know and i can send you the recording
Ignored
@Js3 absolute take up on this offer of listening to the recording .
{quote} Price always draws to liquidity zones so pretty easy to find targets the trick is have the patience to hold..... takes a loada time to acquire that patience... explained how to find them on a few of my Skype sessions... if you are on telegram let me know and i can send you the recording
Joined Jun 2016
|
Status: Sharing EUR/USD Ideas and Insights
|15,528 Posts
The EUR/USD pair weakened this week as it traded near 1.0300. This decline was primarily driven by:
Strengthening US Dollar: Positive US economic indicators and the expectation of a less dovish Federal Reserve have boosted the US Dollar.
Eurozone Concerns: Economic slowdown and geopolitical risks continue to weigh on the Euro.
These factors have combined to put downward pressure on the EUR/USD.
Here are the key technical levels to watch for the EUR/USD:
Resistance Levels:
1.0496: A significant broken support level and a potential resistance zone.
1.0555: A stronger resistance level that could cap upward movement.
Support Levels:
1.0331: A crucial support level that could prevent further downside.
1.0222 - 1.0200: A stronger support zone that could offer significant buying opportunities.
{quote} Yeah super simple pattern - the HL doesn't always hit a previous HH, If it does it means that prev HH or old top is NOW the BASE of the next move, but I wouldn't get that technical with it - trends of that magnitude will by law ALWAYS produce that formation of HH's and HL's, until the trend ends The markets - every market are mathematical and follow the laws of geometry, which is why you can get lots of hits to grids, specific numbers etc Gann said Every high and low point are related to future highs and lows Here's Gann's famous Square...
Ignored
Thank you for your sharing and interesting post. your kindness is appreciated. some Sunday creativity for me.