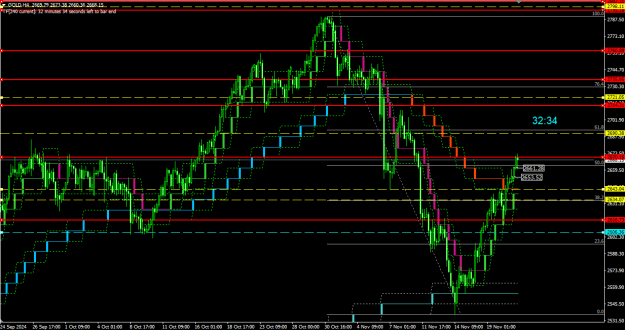
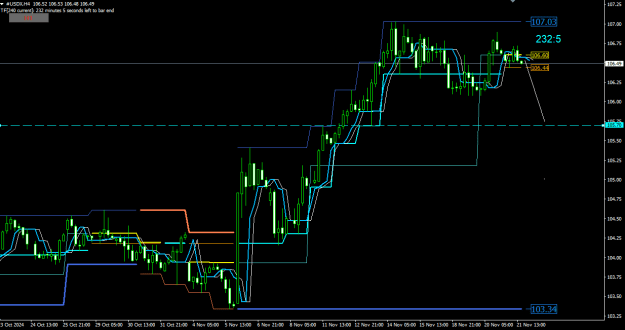
Disliked{quote} Thank you . nice trades. looks like HH then HL and the retrace of the HL is to the top of the previous HH, correct? very simple pattern, love it. much appreciated , thank you for your kind sharing. here is 1, 2, 4 year time period on weekly with 52, 104 and 208 bands, Used to look every weekend for main trends I was taught. and here is my best GANN chart the sq360, I know sq360 a little but for some reason this was made with the 8ths at 330 between each 8th for gold. My previous teacher has posted it before, so I made it up too. 2794 it...Ignored
The markets - every market are mathematical and follow the laws of geometry, which is why you can get lots of hits to grids, specific numbers etc
Gann said Every high and low point are related to future highs and lows
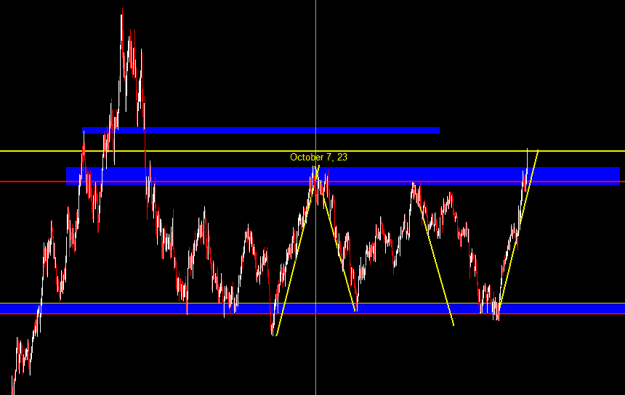
Here's Gann's famous Square of 12 [144] on the SP500 - 288 is twice 144 and worked nicely here for lots of hits as POINTS [price] from 2000
Attached Image (click to enlarge)

This one is from the 1960's!!!!
Attached Image (click to enlarge)

Here's Nasdaq using geometry levels of a past major swing - 52.6 is the INVERSE of 1.902, 1.902 is the diagonal of a golden rectangle and 44.7 is the INVERSE of 2.236, 2.236 is the square root 5 and diagonal of 2 adjacent squares - amazing when you think about it all
Attached Image (click to enlarge)

and to show this isn't some sort of fluke - This is usually the cause of reversals that don't quite hit those key fib levels or slightly over-run them
Attached Image (click to enlarge)

Yes with sideways movement, you'll always get BB squeezes with "pops" out of the compression
I just use moving averages to see the squeeze/compression
The Important thing is that you use methods that suit YOU and make sense to you - then it just becomes a task of working out how to exploit to your advantage
3