Disliked{quote} Is it sufficient to say these pairs (images attached) are bullish using the TDI Indicator? How can someone identify the right entry point? Thanks for walking us the newbies through this learning curve {image} {image}Ignored
@Bimballler
When you want to trade the 4Hr and make money, you need to zoom out and look at the big picture of the market.
You look back to at least the last 5 weeks price action and see what the Daily and Weekly market type conditions were. This would help you decide the potential of any 4Hr trade setup if it would run +9R to +12R profits.
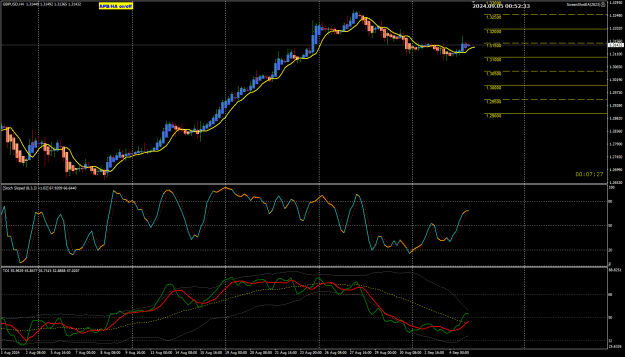
The TDI which is basically Moving Averages of the RSI data therefore is considered as a lagging indicators which is based on past price data. TDI is only tool the OP used as his helping indicator in addition to the Stoch (8,3,3). If you follow his post #261 , the basic trade setup conditions includes the Stoch(8,3,3).
Attached Image (click to enlarge)

When you use the RSI with MAs, also know as the Fozzy-RSI system then you need to study the book by John Hayden
Can the RSI help us determine the market trend?
Well, John Hayden' RSI study has some good information to feed those hungry for knowledge.
RSI: The Complete Guide by John Hayden click to [download]
Trend Determination using the RSI (TDI) click to [download]
...
Honesty is a very expensive gift. You wont find it in cheap people.WBuffett