Disliked{quote} thankyou very much for your detailed post. Its always good to be spending time in the garden getting some well needed sunshine. you have helped alot to fill in some more gaps to try to understand what amyc was doing a few years back. Thank you. I will start off measuring low to low counts. amyc here on forexfactory counted weeks. I upload this photo here from a page of notes made from fxbookies (fxbookies was a site made by some members here, but is not on the net anymore) where I was posting with amyc at the time. Here on the post dated...Ignored
Low to Low counts are favoured over high to high counts, due to being forced to view on a 2 Dimensional price chart - the multi-dimension nature of price action tends to "twist and spin" highs more than lows - however, if you find a set of H-H counts that are good, then use them
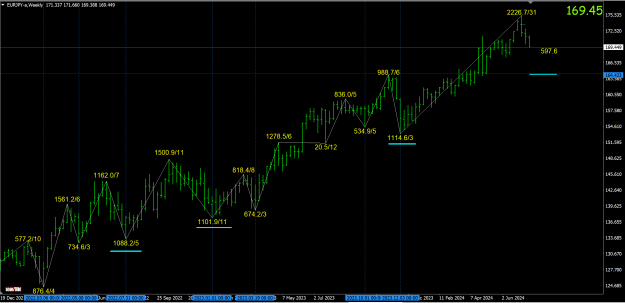
The main thing I would say is get the count, then watch lower time-frames for confirming signals of the turn, but remember the count will never be exact all the time
Attached Image (click to enlarge)

This is Natural Gas 4 year cycle - this shows the Inversions at the left of the chart, but whatever way you view it, there's a 2 year up or down cycle which has come down into the anticipated 4 year low (Feb'24)
Attached Image (click to enlarge)

There's a lot of heavy cycle expectations for the next few years, not least a massive war cycle, lots of commodities are expected to bottom out soon too, which leads onto Inflation and Interest rates - the Interest rate cycle changed in 2020 from down to up and its a 40 year L-H or H-L cycle (80 yr L-L)
I would definitely explore cycles on the side, keep it simple and logical
1