Depends on how you view this - If price trends and ranges and those price extremes fit into lengths, as Hurst discovered back in the 60's and Gann etc before that, then you can crunch those prices into Sinewaves, "adjust" the phase of the cycle length to match price action and create a composite index of all the cycles, sometimes (most of the time) you'll have a highly correlated cycle prediction trend direction
SP500

Natural Gas - notice the 2nd LOW cycle Inverted - It was clearly forming a high rather than a low, so you just flip you're trend expectation - traders need to be able to adjust to price action, but the cycle wave was still there and thereafter arrived bang on time again

UK Stock
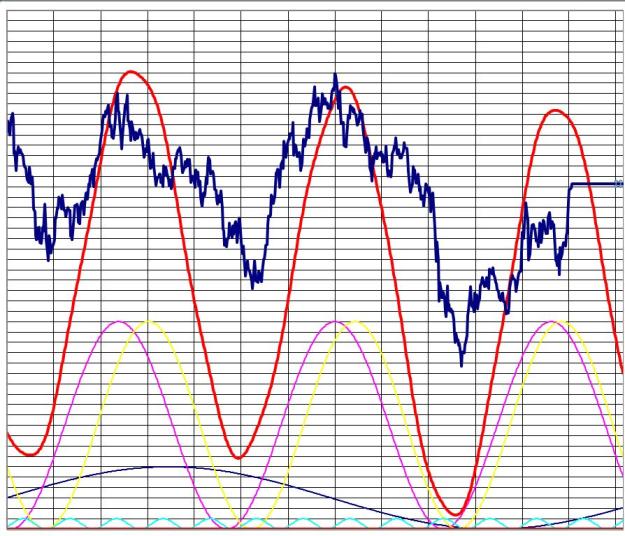
Obviously it is impossible to work out the expected AMPLITUDE of the price move, as markets run off multiple cycles of varying length, that are all interacting with each other, but you will find more often than not, that 1 cycle dominates price action until another takes over etc
The main thing with this is being able to have a high probability idea of turns in terms of TIME - I also have the DJIA from 1900 to 2100 and so far +/- 6 months allowance its been very very very accurate
SP500
Attached Image (click to enlarge)
Natural Gas - notice the 2nd LOW cycle Inverted - It was clearly forming a high rather than a low, so you just flip you're trend expectation - traders need to be able to adjust to price action, but the cycle wave was still there and thereafter arrived bang on time again
Attached Image (click to enlarge)
UK Stock
Attached Image (click to enlarge)
Obviously it is impossible to work out the expected AMPLITUDE of the price move, as markets run off multiple cycles of varying length, that are all interacting with each other, but you will find more often than not, that 1 cycle dominates price action until another takes over etc
The main thing with this is being able to have a high probability idea of turns in terms of TIME - I also have the DJIA from 1900 to 2100 and so far +/- 6 months allowance its been very very very accurate
1


