'In the clearing stands a boxer And a fighter by his trade..'
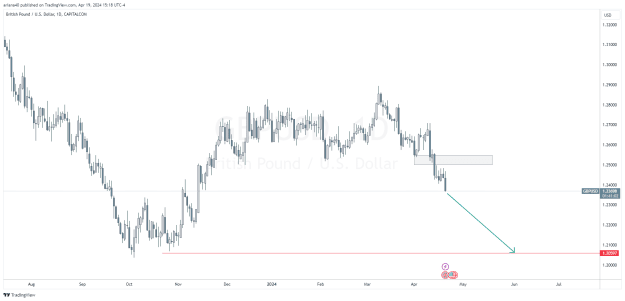
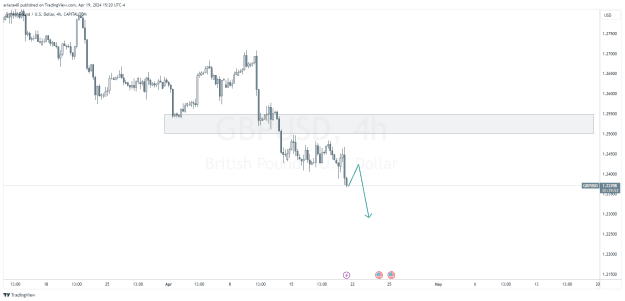
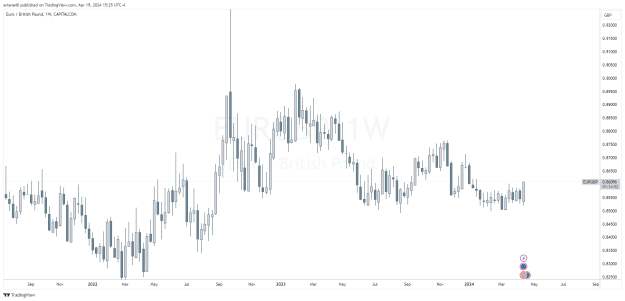
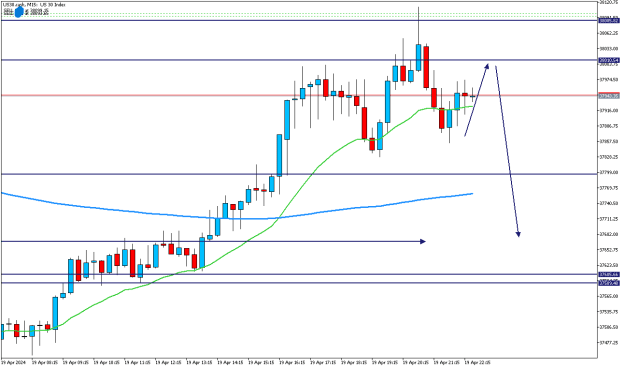
 New Cable Thread & Other Pairs
- #2,367
- Apr 19, 2024 11:46am Apr 19, 2024 11:46am
- | Commercial User | Joined Jul 2013 | 7,916 Posts
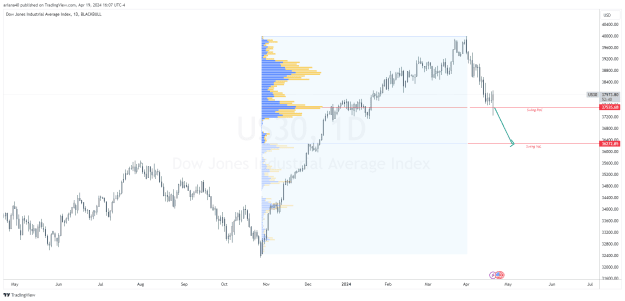
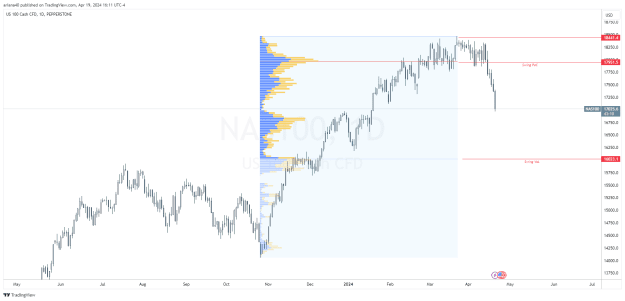
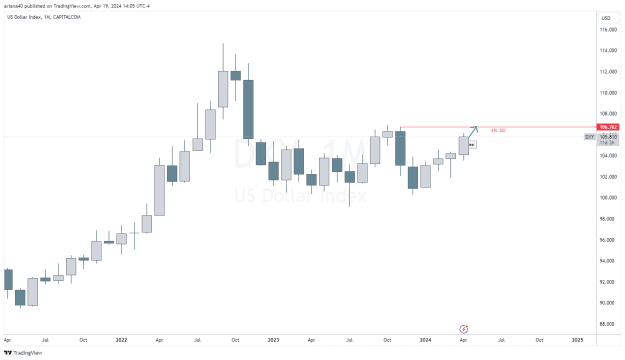
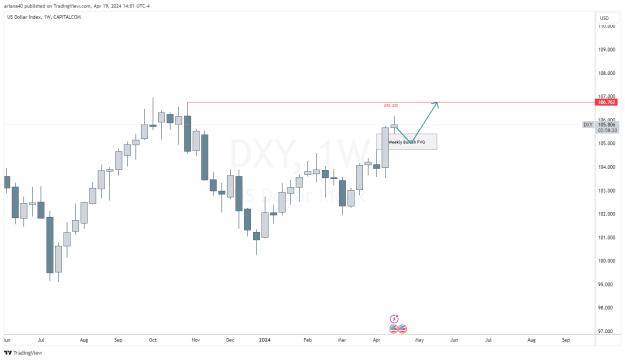
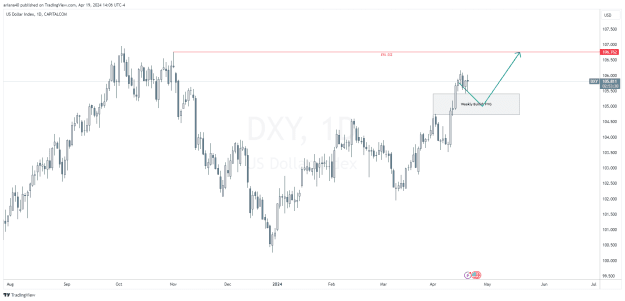
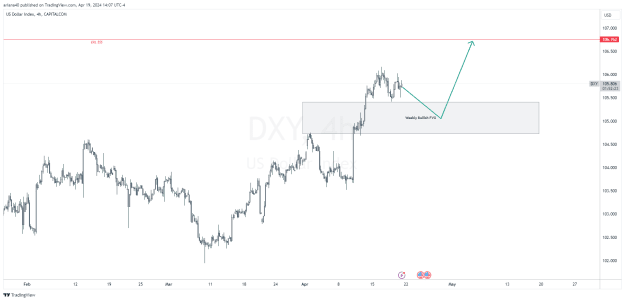
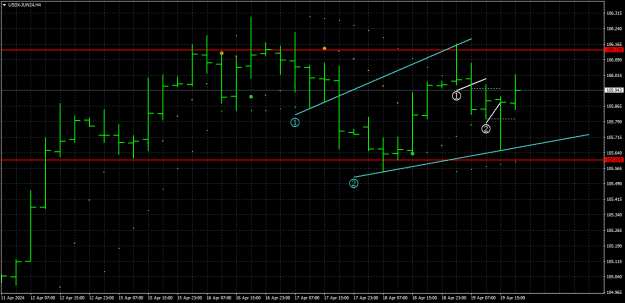
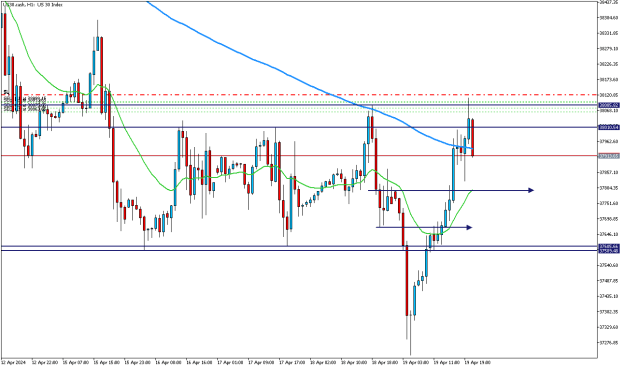
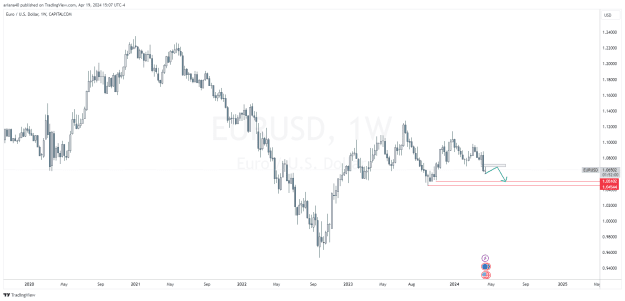
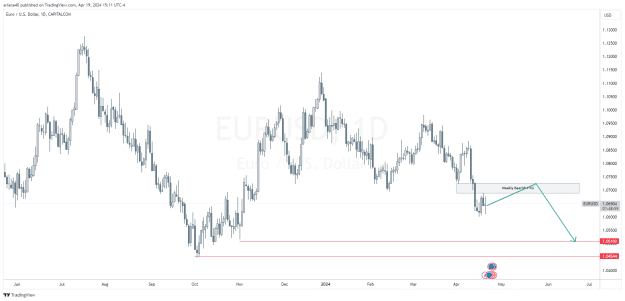
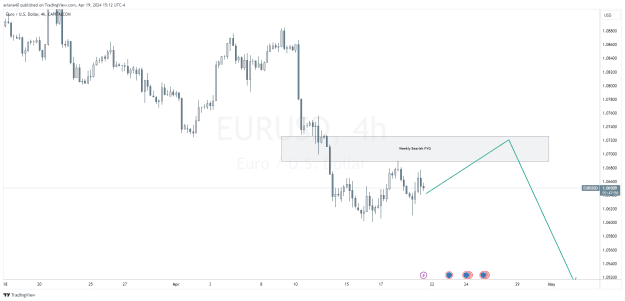
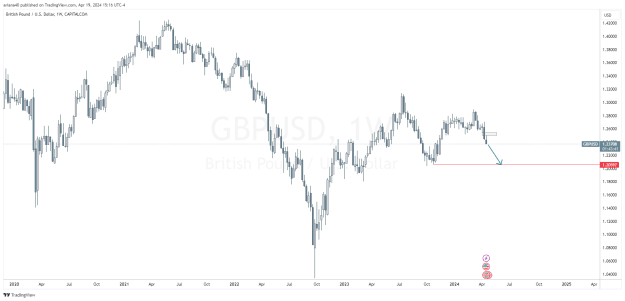
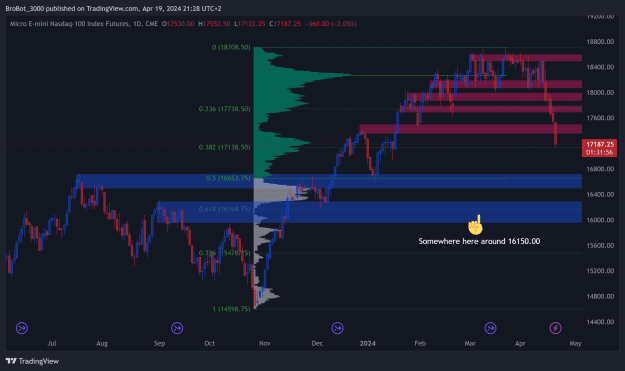
We watch the charts from every angle so you don't have to!!
- #2,379
- Apr 19, 2024 1:06pm Apr 19, 2024 1:06pm
- Joined Jan 2024 | Status: #freepalestine | 3,712 Posts | Online Now

Stop Procrastinating