What is Order Flow?
To start, here's some definitions/answers from around the web:
"Order flow trading is the process of analysing the flow of trades being placed by other traders on a specific market. This is done by watching the Order Book¹ and also footprint charts². Order flow analysis allows traders to see what type of orders are being placed at a certain time in the market, e.g. the amount of Buy and Sell orders at a given price point. Traders can use Order Flow analysis to see the subsequent impact on the price of the market by these orders and therefore make predictions on the future price and direction of the market."
¹ In securities trading, an order book contains the list of buy orders and the list of sell orders. For each entry it must keep among others, some means of identifying the party (even if this identification is obscured, as in a dark pool), the number of securities and the price that the buyer or seller are bidding/asking for the particular security. In this type of analysis, from my experience, it can be more subjective and subject to manipulation (spoofing) then 'footprint chart' trading.
² Footprint charts (sometimes known as numbers bars or volume bars/candles) show the individual buy and sell orders placed within candlesticks (price levels) and therefore give a deeper view on the micro price movements. Order Flow traders can see both Limit orders and Market orders being placed (passive and aggressive respectively). Footprint charts show only executed market orders and therefore show the actual volume of buyers and sellers.
Limit orders are price points where traders have ordered to buy or sell a stock, these orders will not get executed unless the price of the market hits their limit order price point. Market orders are aggressive, the trader wants to participate now and fast, willing to risk slippage. Pending limit orders (orders yet to be filled) are not shown on 'footprint charts' and can only be seen on Order Books, once these orders have been executed they turn to Market orders which are then displayed on the chart.
I have chosen to specialise in post trade settlement order flow trading, for many reasons but put simply, the numbers printed on the footprint chart do not change and manipulation cannot be obscured as effectively as it is in order book trading. You however may have better and brighter ideas and goals than me, I encourage you to learn as much as you can on both aspects of order flow! That being said, this post will be dedicated solely to footprint/actual volume analysis, I just wanted to make sure everyone knows there's much depth and complexity to this subject and anything I say may not be the 'be all and end all' etc.
To begin, I'd like to go over some of my personal collection of general information on the topic of order types and aggressiveness in markets and whys its very important. I first made it to better understand and explain Auction Market Theory however it is the exact same information relevant to this discussion.
AGGRESSIVENESS (MARKET ORDERS) IN MARKETS: WHY IT'S IMPORTANT
Limit orders and stop orders
The advertisement of limit orders is placed on the DOM/order book and is executed against the incoming market orders. These are often called the heavier hand in the market as large players can’t afford to use market order because they would often incur more considerable slippage.
They use various advanced order types such as icebergs to hide their intention and not get front-runned.
If you are putting a limit order to the order book, you are making liquidity. Because limit orders are the heavier hand, they are the ones that stop markets in trending environments from advancing or declining as aggressive market participants (market orders) often hit the limit walls and get absorbed. They stop markets.
Market Orders
Market orders are executed “at the market”. They show us the finalized transactions on the bid and the offer, referred to as the delta. They are executed against the limit orders.
Market orders are required for the market to move.
Whenever market orders exceed the number or limit orders at a given price point, the price ticks up or down. As you take liquidity from the order book, you are a liquidity taker every time you use the market order.
Although brokers offer a lot of different order types, these are still just market or limit orders.
Attached Image (click to enlarge)
The opposite would be the high volume with low liquidity. In these markets, aggressive participants enter the market with a not strong counterparty at the order book, causing highly volatile movements. This is the case for markets such as Dax, Gold, YM, or Bitcoin.
It is the aggression (amount) of the market orders in comparison to limit (passive) orders that moves the market from one price level to another.
Order Flow Trading
I think it is very important to always clarify this before explaining or talking about passive and aggressive orders/market participants in a footprint chart. Within a standard bid x ask footprint candle, the left side shows the bid volumes (aggressive sellers) and the right showing the ask volumes (aggressive buyers) but where are the passive (limit) sellers and buyers? This is where it becomes confusing for a beginner, passive sellers actually show on the ask and vice versa!
If you understand this you'll likely be asking how to differentiate the two immediately, unfortunately there is no definite way however, the better you become at this the better trader you'll be! Using context and a deep understanding or order flow - price dynamics you can often make the right assumption as to what the volumes your seeing are.
Attached Image (click to enlarge)
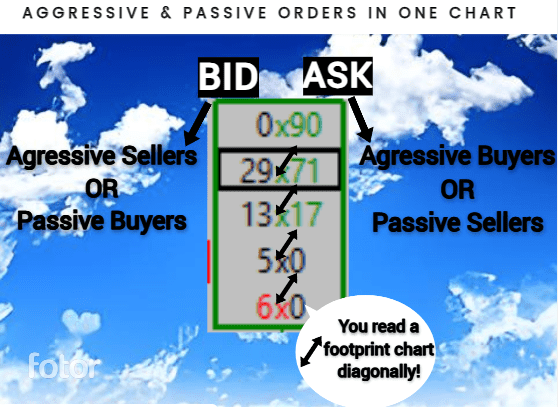
The black rectangle within the centre of the candle/footprint (common among all software/services) highlights that footprint's Point Of Control (P.O.C) which is the exact price level where the heaviest trading volumes were traded.
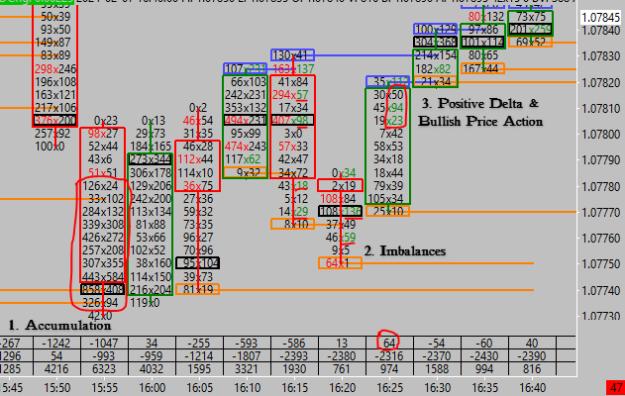
That's a brief overview of a single footprint candle and its most important factors, now lets look at a random chart screenshot and point out the most significant parts:
Attached Image (click to enlarge)
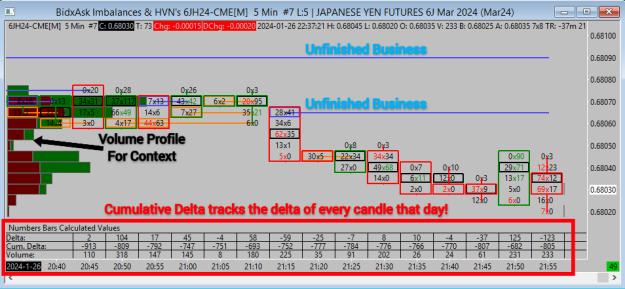
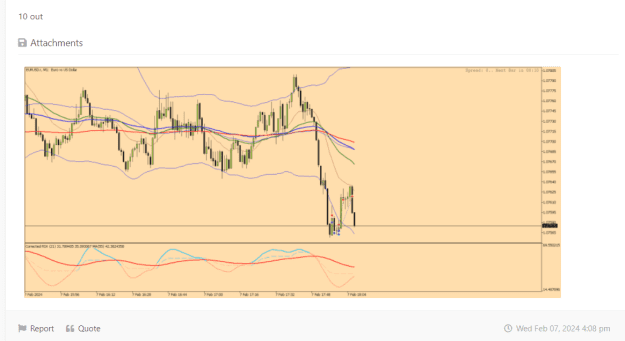
Below every footprint (placement may change on your software) is the Delta for that footprint, being the sum of all trades within that time period (Ask Volume - Bid Volume). The Cumulative Delta, usually beside delta itself, tracks all delta changes throughout that specific day and can provide valuable clues as to the day's trend direction and positioning etc.
The blue lines are representing what's called 'Unfinished Business'. This is where price made a high/low but with volumes on both bid x ask, there was not one last person buying/selling at the very top or bottom like a normal auction. In price action trading, this is sometimes named a 'failed auction'. Ultimately, price has a tendency to revert back to these particular price levels, completing or fixing the auction.
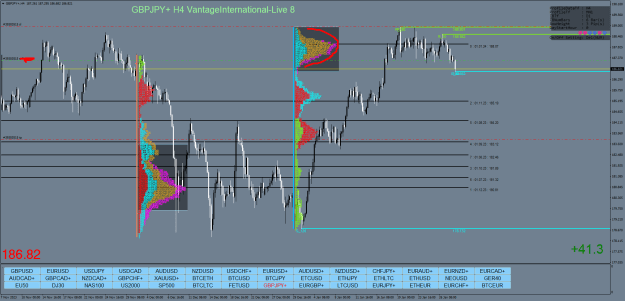
You can use all these tools and analysis methods on every intraday timeframe however so far this has been about granular level detail on volume and different types of market participants and as such I recommend using the 1 - 15 minute timeframes for this specific type of analysis. I will now go into how to use order flow, more specifically footprint charts for longer timeframe analysis (30 minute timeframe and up).
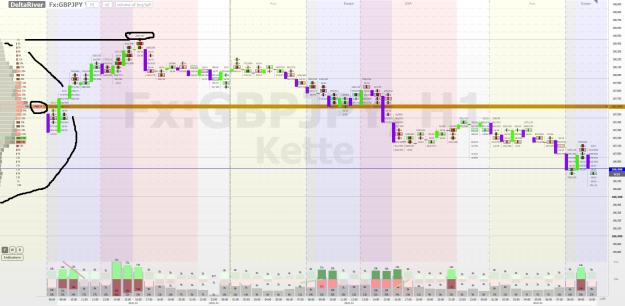
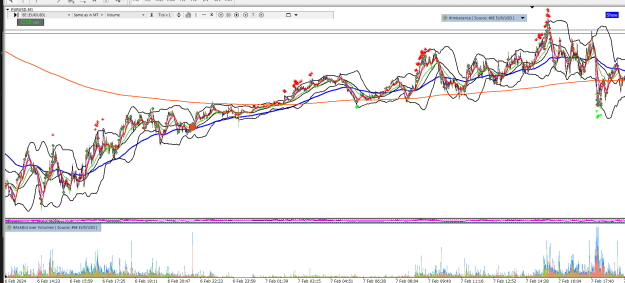
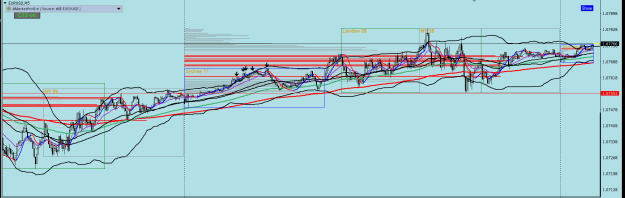
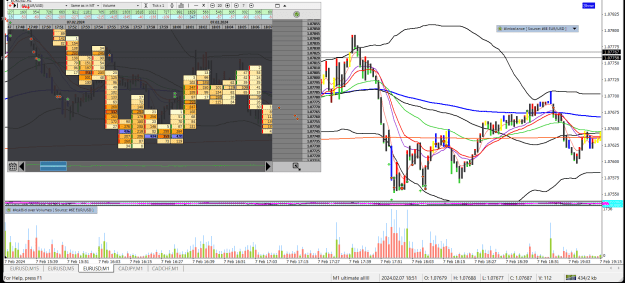
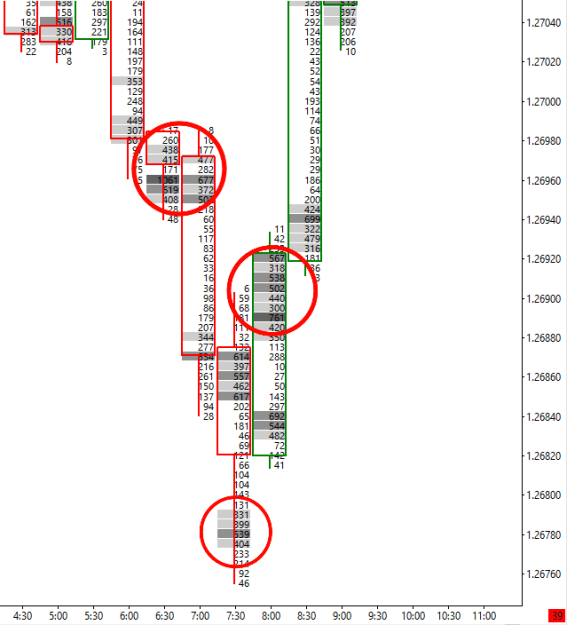
Instead of using bid x ask footprints charts now, we can use total volume instead although you can experiment with other volume equations to try find an extra edge. This way we can still see where the largest market participants were trading on a larger timeframe, the ideology of why prices bounce/reject or are attracted to these areas is the same regardless of the timeframe involved! I recommend using a software/service that allows deep customizability, as you can then automatically highlight high volume clusters on the chart without having to look at each and every number. This longer-view type of analysis can be used with spot FX data although its always recommended to use futures for the greatest accuracy. Below is a screenshot of my chart showing how this looks:
Attached Image (click to enlarge)
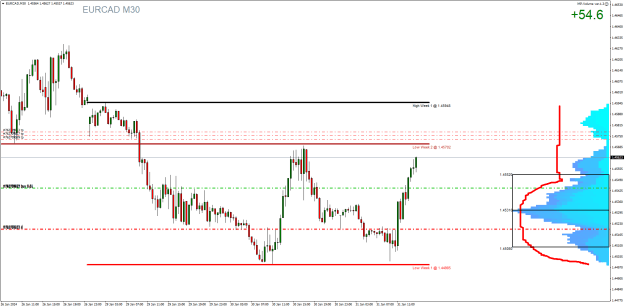
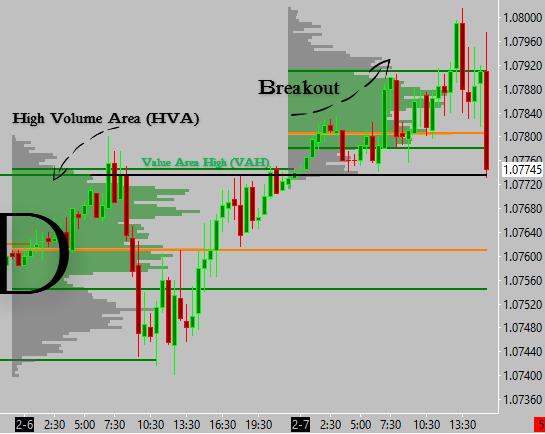
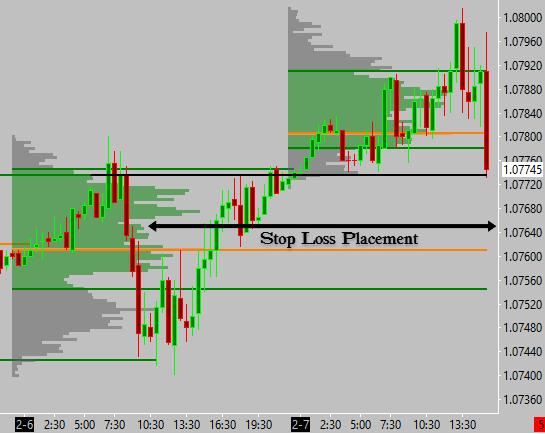
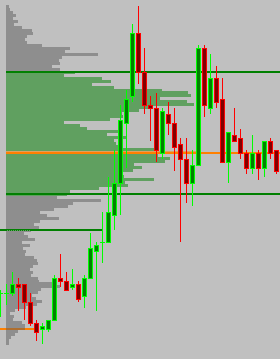
You should always be aware of High Volume Areas (HVA) as they can turn out to be significant support or resistance levels! Looking at volumes in this unique way allows us to do this more effectively. The higher the timeframe your analysing, the higher your threshold for what classifies as 'high volume' naturally. This analysis can be done on even longer time frame charts however at that point you can move onto Volume Profile charts for daily or greater timeframes and/or analysis periods. Below is a screenshot of what a plain 30 minute candlestick chart looks like with a daily volume profile overlaid, this is the standard volume profile layout:
Attached Image
From here I'm going to copy n paste a part of one of my replies to this thread to give some examples of how I use order flow and the situations that occur for context and so on.
"I should say, learning to read order flow takes time and hard work. That's to say, if you think about standard candlestick charts, how many different ways are there to read it? The answer is infinite, everyone has a different understanding of what a singular candlestick means or what a HH - HL - HH - HL (basic uptrend definition) means, let alone how they then interpret it. I bring this up because order flow is objectively more complex than standard price data and thus the subsequent interpretation of order flow is much more complex than regular candlestick charts for example (and look how many different ways traders analyse them as is!), of which there is no correct way to interpret. There is no exact ruleset on how to interpret this data, anything I say may be not important to another order flow trader and so on. This is where I think there could be so much value in a thread of order flow traders, each giving a run down of what they look for and the reasoning behind it. In the meantime I'll just give you a general run down of what I look for and the reasoning behind it.
Example scenario one (for context): Price is coming down, into a price zone that has not been traded since an aggressive reversal took place, this is my long setup. That's it, now for simplicity, I either want to confirm or reject this trade setup and either enter or do nothing respectively.
When I look to the footprint chart, in this scenario, I will be looking for one thing in particular and you'll notice the logic as to why. That being further aggressiveness coming back into the market, in the area of past aggression! So how do we actually look for this? By looking for bid x ask imbalances. What are bid x ask imbalances? One side of the market is much stronger than the other (ask is 300% or larger than the bid) and shows aggression. If imbalances are present with a positive delta (strong buyers) that's all I'd need to confirm, there's no need to make it overcomplicated although you can. If there was no imbalances, then no trade to be taken.
Example scenario two (for context): I am bullish. Price is coming down, into a previous day's Point Of Control (P.O.C - heaviest traded price level of the day) and I want to buy, but I also want to confirm the idea.
In this example, a multitude of confirmations could be used because I already have a view on what will happen, I'm just looking for an entry confirmation. However say this is a trade setup, according to my trading strategy, I will mainly be looking for one thing. As with the previous example, the confirmations are relevant to the context. I would want to see heavy volumes (ideally on both bid x ask) on and around the P.O.C, showing large market participants are still present and transacting there and thus are likely to stop price from moving further before these orders are all filled.
Example scenario three (for context): Price is rising, its just about to come into contact with a classic important resistance level. As I said, all can be used but one order flow confirmation logically jumps out and would confirm this trade perfectly.
I would want to see large passive participant's entering short at the resistance zone. They have been watching this price level (just like you) and have been waiting patiently to enter via limit orders at these levels. This confirms that the level is truly important and its not just a support/resistance area you have created out of thin air. Limit orders also have the ability to stop a market in its tracks so its also another extra buffer between your entry and stop loss!
The logic between context and confirmations are the same! Previous area of price aggression - confirm via current aggression. Previous most heavily traded price level - confirm via significant heavy volumes (possibly the most significant of the current day) and so on.
For the first two examples, I (ideally) want delta in my direction as put in the most basic terms, positive delta equals strong buyers and vice versa. Cumulative delta is the same but tracks the sum of all delta changes throughout the day. The reason why I say the first two only, is that the third talks about limit orders and they distort the deltas use in this type of analysis. This is where I loop back to the start and say that I'm sure each individual order flow trader will have different favourite confirmations and other ways to use delta and so on. I recommend you strive to research and study more on the matter in every way possible!"
I am not the first to touch on this subject, many others have in detail, of course with varying degrees of usefulness and relevance etc. For those who want more on the subject, while staying on forex factory, here is a interesting thread on the topic of order flow.
Seeking Fair Value
12