A Trade Set Up & Explanation From Today (Tuesday 7th May 2024)
Hi traders, today I have a complete trade set-up and breakdown according to this strategy, with full explanations by me. If anyone is confused as to the specifics of the strategy or how I analyse Order Flow, please read the thread from the start, all the info is within and if not feel free to PM me! I lower the quality of photos to fit FF's requirements, click on any screenshots/pictures for a better view/resolution.
Context: Daily Volume Profile Analysis
To start off with at the start of the week, Monday 6th May 2024, price printed a standard 'D' profile at the day's close. We observe and categorize this in real-time in preparation for the day ahead, as the rules of this strategy and this profile specifically state.
Attached Image (click to enlarge)
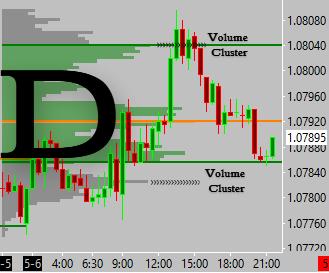
Now we have categorized the prior daily Volume Profile as a 'D' profile, we know how to trade it according to the rules; Large Volume Clusters (High Volume Area) at either the top or bottom are to be seen as significant support/resistance areas of which any confirmed rejection/bounce off of those levels by Order Flow result in placing a mean-reversion style trade.
Attached Image (click to enlarge)
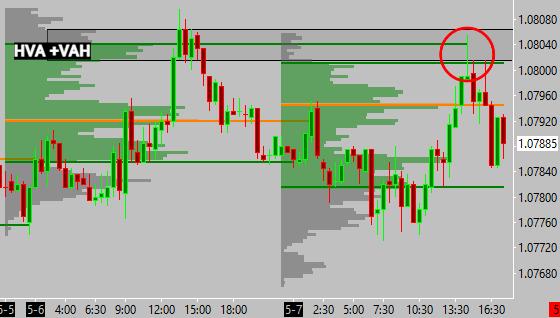
In the screenshot above you can see that the upper HVA is at the same price levels as Monday's Value Area High (VAH - Green Line) this extra confluence adds importance to the resistance area highlighted.
Without delving too deep into Auction Market Theory (my main trading philosophy) the Value Area within a Volume Profile is the area where the most trade was facilitated (70% of volume encompassed within the profile takes place within the Value Area) and as such is described as the fairest prices or where Value is located. It is said that price sends majority of its time within Value as this is where most trade is facilitated, with the market's main purpose being to facilitate trade.
The Value Area High (VAH) is the top of the Value Area. The Value Area Low (VAL) is the bottom of the Value Area. Both of these levels are usually the range/bracket extremes when price is ranging within Value and provide excellent reference points when forecasting/reacting to price's dynamic relationship with Value. Put more simply the VAH & VAL can be effective support/resistance levels.
This is not even the tip of the iceberg in terms of trading with Market Profile & Auction Market Theory in general, as I have said I will go into this in detail, possibly in a new dedicated thread in the future.
AMT aside, on Tuesday 7th May (today) EURUSD did very little until around midday (UK time) when price shot up into our levels of interest. At this point it would be foolish and against the rules of the strategy to pre-emptively jump in a trade without first confirming the set-up via Order Flow:
Confirmation: Order Flow Footprint Analysis
Attached Image (click to enlarge)
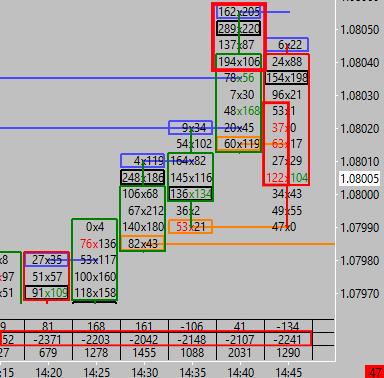
Above is a screenshot of the moment price reacted to our highlighted resistance zone (High Volume Area + Value Area High) on a 5-minute footprint chart. Accumulation (large volumes on both bid x ask) and Inverted Imbalances (Aggressive Sellers) were apparent but the 1-minute chart was much more revealing:
Attached Image (click to enlarge)
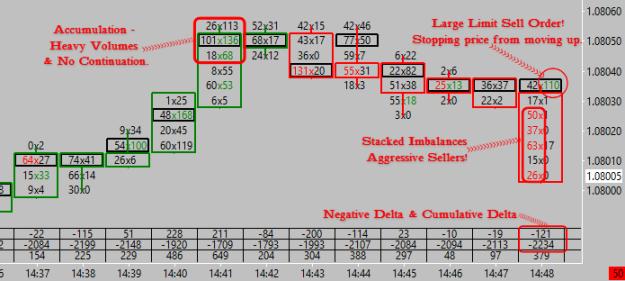
Starting from the left, price reached a ceiling and proceeded to trade heavy volumes but with zero price movement/continuation and as such it may be Accumulation taking place and in this situation it is bearish.
The next three powerful confirmations all took place within the 2:48PM 1-minute candle; A large Limit Sell Order stopping price from proceeding is highlighted at the top of the candle; Stacked Inverted Imbalances highlighted throughout the candle show continuous seller strength; both the Candle's Delta and the day's Cumulative Delta was negative, further echoing seller strength.
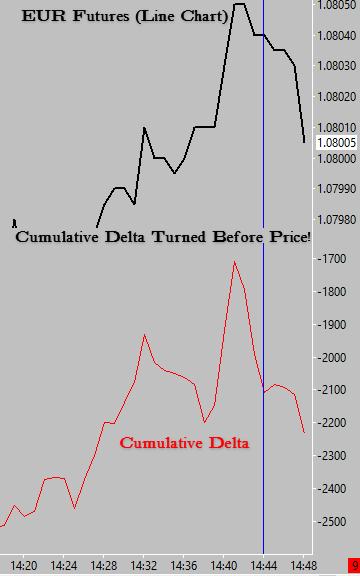
Although I didn't catch it at the time I still think its value is worthy of a quick discussion; Cumulative Delta's Amazing Ability At Predicting Price Swings! In the screenshot below notice how the Cumulative Delta fully turned before price, yet more evidence of the power of Cumulative Delta:
Attached Image (click to enlarge)
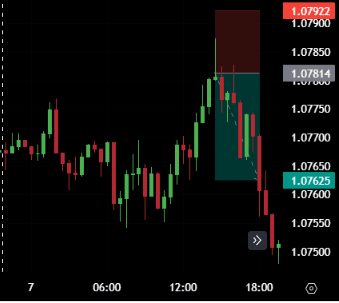
Following the strategy & profile specific rules tell us to put a fixed minimum Risk-Reward ratio of 1:1.75 on the trade as the original profit target (P.O.C) is too close. The Stop Loss was placed just above Monday's trading range high, in a area of Low Volume, risking 11 pips.
Finally, lets look at the trade on a plain 30-minute candlestick chart:
Attached Image (click to enlarge)
I hope this was a good addition to the thread and of to some value and I wish everyone a good rest of your day/night!
Trade safe,
MM
Seeking Fair Value
4