The Average Discount Everything
- #1,223,301
- Edited 6:35pm Jan 23, 2024 6:06pm | Edited 6:35pm
- Joined Dec 2012 | Status: Trader | 4,714 Posts
- #1,223,303
- Jan 23, 2024 9:22pm Jan 23, 2024 9:22pm
- Joined Dec 2012 | Status: Trader | 4,714 Posts
The Average Discount Everything
- #1,223,304
- Jan 23, 2024 9:30pm Jan 23, 2024 9:30pm
- Joined Nov 2018 | Status: Trader | 4,643 Posts
ex nihilo
- #1,223,307
- Jan 25, 2024 2:00am Jan 25, 2024 2:00am
- Joined Jan 2019 | Status: Trader | 2,817 Posts
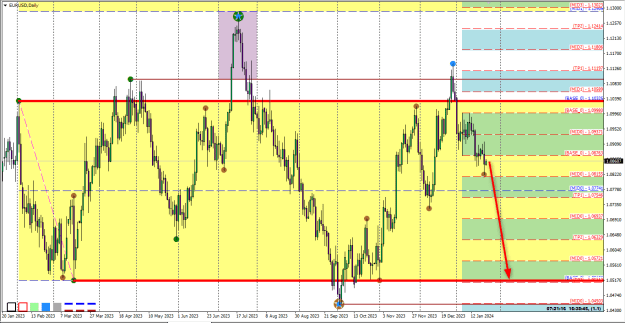
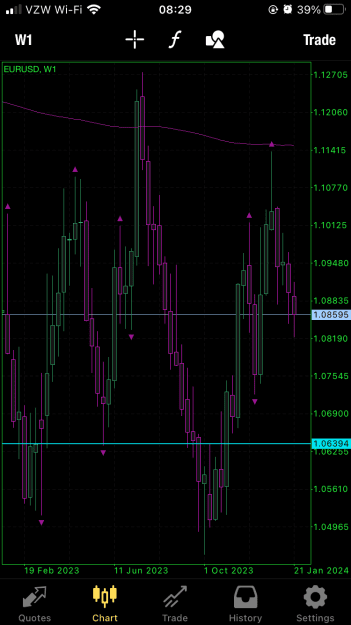
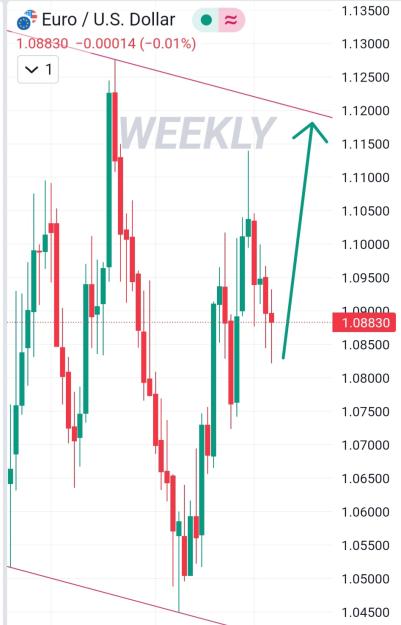
My technical analysis leading trades depend on Daily/Weekly/Monthly Chart
- #1,223,308
- Jan 25, 2024 2:52pm Jan 25, 2024 2:52pm
- Joined Aug 2012 | Status: Love for all; Hatred for none | 3,566 Posts
Love for all; Hatred for none.
- #1,223,310
- Jan 26, 2024 4:06am Jan 26, 2024 4:06am
- Joined Aug 2012 | Status: Love for all; Hatred for none | 3,566 Posts
Love for all; Hatred for none.
- #1,223,311
- Jan 28, 2024 11:37am Jan 28, 2024 11:37am
https://www.myfxbook.com/members/Iressent/spektrum/11572381
- #1,223,312
- Jan 28, 2024 1:28pm Jan 28, 2024 1:28pm
- Joined Dec 2015 | Status: Trader | 8,759 Posts
Do your homework, follow the footprints of smart money
- #1,223,313
- Jan 28, 2024 4:30pm Jan 28, 2024 4:30pm
- Joined Aug 2012 | Status: Love for all; Hatred for none | 3,566 Posts
Love for all; Hatred for none.
- #1,223,314
- Jan 29, 2024 3:00am Jan 29, 2024 3:00am
- Joined Aug 2012 | Status: Love for all; Hatred for none | 3,566 Posts
Love for all; Hatred for none.
- #1,223,316
- Jan 29, 2024 2:50pm Jan 29, 2024 2:50pm
- Joined Aug 2012 | Status: Love for all; Hatred for none | 3,566 Posts
Love for all; Hatred for none.
- #1,223,317
- Jan 30, 2024 3:34am Jan 30, 2024 3:34am
- Joined Aug 2012 | Status: Love for all; Hatred for none | 3,566 Posts
Love for all; Hatred for none.
- #1,223,318
- Jan 30, 2024 10:46am Jan 30, 2024 10:46am
- Joined Jan 2019 | Status: Trader | 2,817 Posts
My technical analysis leading trades depend on Daily/Weekly/Monthly Chart
- #1,223,319
- Jan 30, 2024 11:07am Jan 30, 2024 11:07am
- Joined Jan 2019 | Status: Trader | 2,817 Posts
My technical analysis leading trades depend on Daily/Weekly/Monthly Chart
- #1,223,320
- Jan 30, 2024 2:24pm Jan 30, 2024 2:24pm
- Joined Aug 2012 | Status: Love for all; Hatred for none | 3,566 Posts
Love for all; Hatred for none.