let's summarize (again) the close relationship existing between Gann and Hurst :
the main relationship is the Factor 2
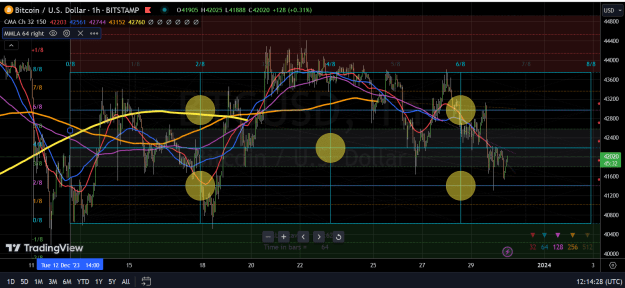
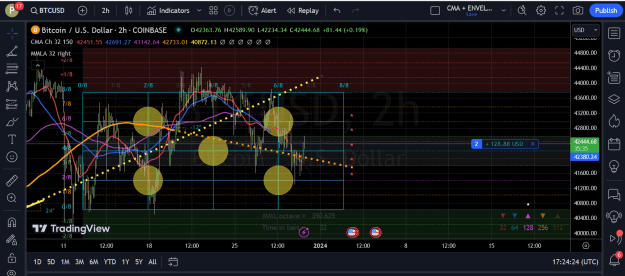
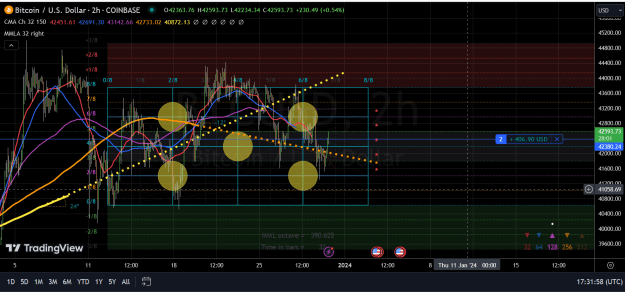
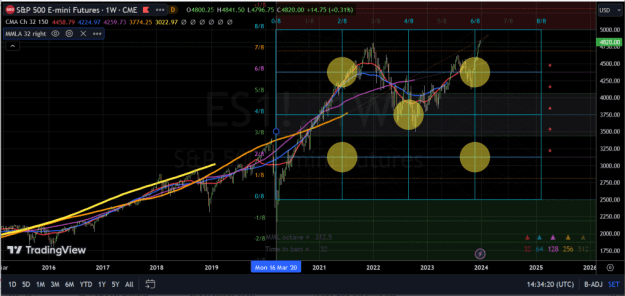
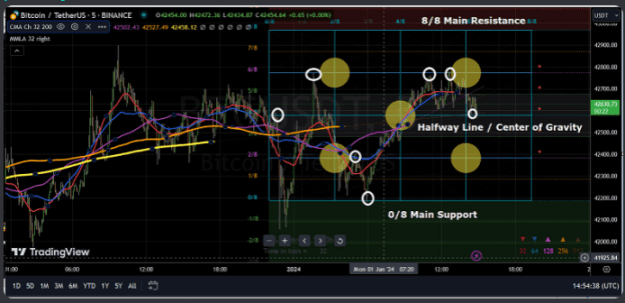
the key point on a chart for Gann is the Halfway Point - middle between the High and the Low
the Halfway Point is similar to the Hurst/Tillman Focal Point - intersection of various CMA's with Price Action at the Midlle of the Swing. or of the Future Line of Demarcation (FLD) crossing Price Action in the middle of a Swing allowing to calculate a Target Price.
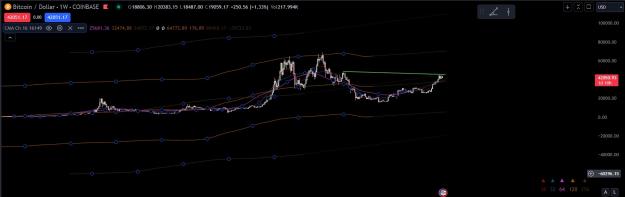
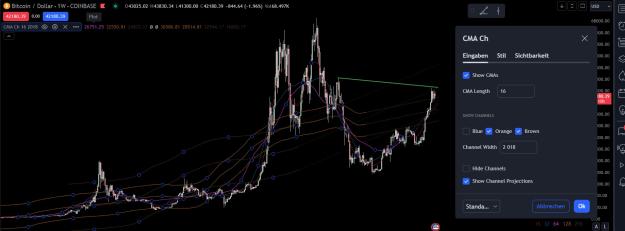
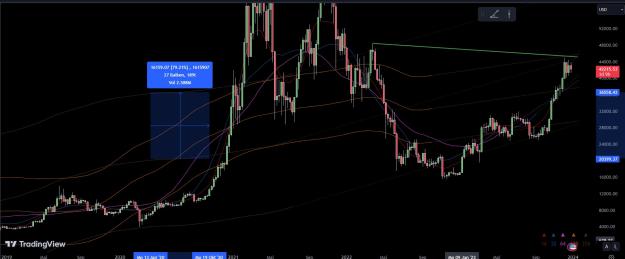
The Hurst Centerline between 2 Envelopes Boundaries can be considered as a moving Halfway Point.
The factor 2 and 3 are also used by Gann and Hurst in a similar way.
Hurst uses it as a (theoretically) fixed relationship between successive adjacent Cycles.
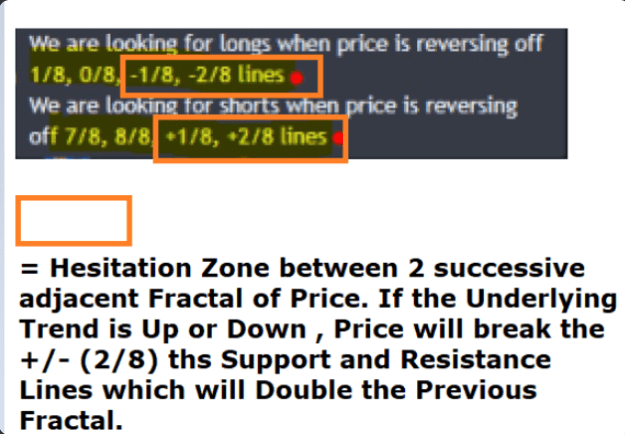
Gann uses 2 and 3 to divide both the price Range and the Time Range , even if Gann focuses more on the Division by 2.
The division by 8 (2x2x2) of the Price Range being a by-product of the division by 2
the main relationship is the Factor 2
the key point on a chart for Gann is the Halfway Point - middle between the High and the Low
the Halfway Point is similar to the Hurst/Tillman Focal Point - intersection of various CMA's with Price Action at the Midlle of the Swing. or of the Future Line of Demarcation (FLD) crossing Price Action in the middle of a Swing allowing to calculate a Target Price.
The Hurst Centerline between 2 Envelopes Boundaries can be considered as a moving Halfway Point.
The factor 2 and 3 are also used by Gann and Hurst in a similar way.
Hurst uses it as a (theoretically) fixed relationship between successive adjacent Cycles.
Gann uses 2 and 3 to divide both the price Range and the Time Range , even if Gann focuses more on the Division by 2.
The division by 8 (2x2x2) of the Price Range being a by-product of the division by 2
2