Hello Traders, today I am going to discuss a forex strategy that you can apply right now. Before I move to the strategy, I want to clarify several concepts necessary for you to understand before you can jump into the strategy.
1. **Daily Liquidity Pools**
2. **Fair Value Gaps**
3. **How to trade like Algorithm using FVG and time**
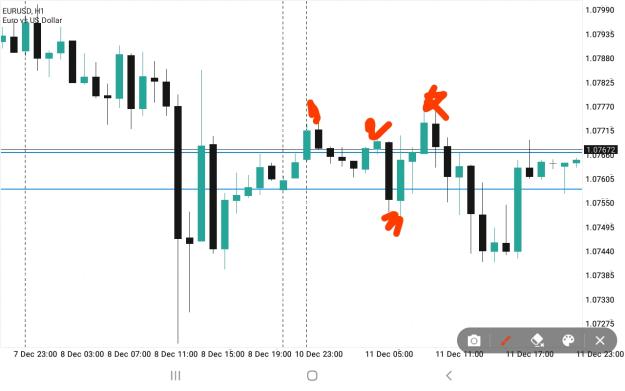
**What are Liquidity Pools?** To give you a simple explanation, liquidity pools are areas where retail traders place their buy stops and sell stops. Retail psychology often assumes that when the price goes below a support area, it will keep going down, and vice versa for breaking above resistance. Algorithmic patterns exploit this by breaking above those highs, activating buy stops, and then reversing. It's crucial to remain aware of these pools to avoid falling prey to algorithms.
Look at the chart below. The blue lines represent the daily high and low during the weekend. The following Monday, the price broke above and below multiple times, activating retail buy and sell stops before returning to a pivot and hitting most of the retail stop losses. This pattern is a global phenomenon.
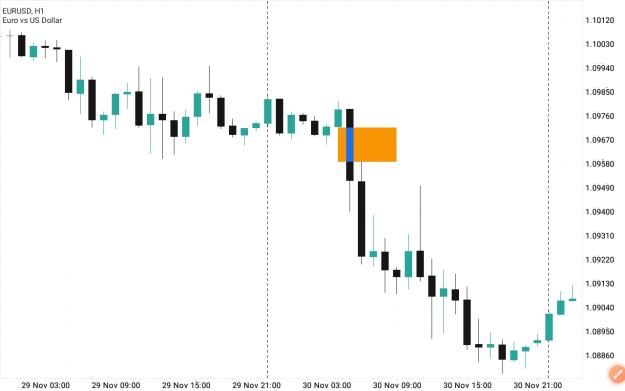
**Fair Value Gap (FVG)?** Fair Value Gap is an ICT concept, the sole property of Sir Michael. I encourage you to learn more on ICT's 2022 Mentorship program on his YouTube Channel. In simple terms, FVG is the remaining blueprint of algorithms in your chart, visible as gaps between candlesticks.
Consider renovating your house with a paint roller analogy. If you keep rolling it up without enough paint, there will be blank places on the walls. Similarly, when algorithms change direction, you'll see gaps between candles. This is inefficiency – Fair Value Gaps.
On the chart, notice the clear gap between the low of the previous candle and the high of the next candle – a Fair Value Gap.
**How to Target the Closest FVG using only H1 & M5 charts: Easy!**
- Go to the Hourly chart, identify FVGs, and mark them.
- Go to the M5 chart, wait for price consolidation, and create an FVG in the direction of the closest H1 FVG.
- Wait for price to break the closest structure and close beyond it.
- Place an order in the direction of the H1 FVG.
- Set stop loss below/above the swing high/low. Take profit at the beginning point of the H1 FVG.
**What to Consider while Choosing the Target FVG:**
- If the liquidity pool is closer to the current price than the H1 FVG, target the liquidity pool.
- If both FVG and liquidity pool have identical distances, wait for M5 price movement.
- If confused, wait for the session to pass. Don't engage when uncertain.
- The risk-to-return ratio must be equal to or greater than 1:2, or let the opportunity pass by. It doesn't worth it.
**What about News Events?** Algorithm uses news events to expedite its move, leveraging volatility to manipulate prices. Novice traders should observe, as algorithms don't care if the news is good or bad; they exploit volatility.
**When to Trade** Your search for a perfectly simple ICT Killzone indicator for MT5 is now over because here it is. If you trade ICT concepts, then you know what ICT Killzones are.
Indicator: https://www.mql5.com/en/market/produ...ource=External
ICT Killzones (by default is adjusted to EST New York Time, no recalibrating to your timezone needed. Just load it onto your chart and you're good to go):
Asian Open Killzone (06:00PM - 12:00AM EST New York Time)
London Open Killzone (02:00AM - 05:00AM EST New York Time)
New York Open Killzone (07:00AM - 9:00AM EST New York Time)
London Close Killzone (10:00AM - 12:00PM EST New York Time)
Recommend Broker: https://register.hfm.com/sv/en/new-l.../?refid=376050
1. **Daily Liquidity Pools**
2. **Fair Value Gaps**
3. **How to trade like Algorithm using FVG and time**
**What are Liquidity Pools?** To give you a simple explanation, liquidity pools are areas where retail traders place their buy stops and sell stops. Retail psychology often assumes that when the price goes below a support area, it will keep going down, and vice versa for breaking above resistance. Algorithmic patterns exploit this by breaking above those highs, activating buy stops, and then reversing. It's crucial to remain aware of these pools to avoid falling prey to algorithms.
Look at the chart below. The blue lines represent the daily high and low during the weekend. The following Monday, the price broke above and below multiple times, activating retail buy and sell stops before returning to a pivot and hitting most of the retail stop losses. This pattern is a global phenomenon.
Attached Image (click to enlarge)
**Fair Value Gap (FVG)?** Fair Value Gap is an ICT concept, the sole property of Sir Michael. I encourage you to learn more on ICT's 2022 Mentorship program on his YouTube Channel. In simple terms, FVG is the remaining blueprint of algorithms in your chart, visible as gaps between candlesticks.
Consider renovating your house with a paint roller analogy. If you keep rolling it up without enough paint, there will be blank places on the walls. Similarly, when algorithms change direction, you'll see gaps between candles. This is inefficiency – Fair Value Gaps.
On the chart, notice the clear gap between the low of the previous candle and the high of the next candle – a Fair Value Gap.
Attached Image (click to enlarge)
**How to Target the Closest FVG using only H1 & M5 charts: Easy!**
- Go to the Hourly chart, identify FVGs, and mark them.
- Go to the M5 chart, wait for price consolidation, and create an FVG in the direction of the closest H1 FVG.
- Wait for price to break the closest structure and close beyond it.
- Place an order in the direction of the H1 FVG.
- Set stop loss below/above the swing high/low. Take profit at the beginning point of the H1 FVG.
Inserted Video
**What to Consider while Choosing the Target FVG:**
- If the liquidity pool is closer to the current price than the H1 FVG, target the liquidity pool.
- If both FVG and liquidity pool have identical distances, wait for M5 price movement.
- If confused, wait for the session to pass. Don't engage when uncertain.
- The risk-to-return ratio must be equal to or greater than 1:2, or let the opportunity pass by. It doesn't worth it.
Inserted Video
**What about News Events?** Algorithm uses news events to expedite its move, leveraging volatility to manipulate prices. Novice traders should observe, as algorithms don't care if the news is good or bad; they exploit volatility.
**When to Trade** Your search for a perfectly simple ICT Killzone indicator for MT5 is now over because here it is. If you trade ICT concepts, then you know what ICT Killzones are.
Indicator: https://www.mql5.com/en/market/produ...ource=External
ICT Killzones (by default is adjusted to EST New York Time, no recalibrating to your timezone needed. Just load it onto your chart and you're good to go):
Asian Open Killzone (06:00PM - 12:00AM EST New York Time)
London Open Killzone (02:00AM - 05:00AM EST New York Time)
New York Open Killzone (07:00AM - 9:00AM EST New York Time)
London Close Killzone (10:00AM - 12:00PM EST New York Time)
Inserted Video
Recommend Broker: https://register.hfm.com/sv/en/new-l.../?refid=376050
Protect your capital