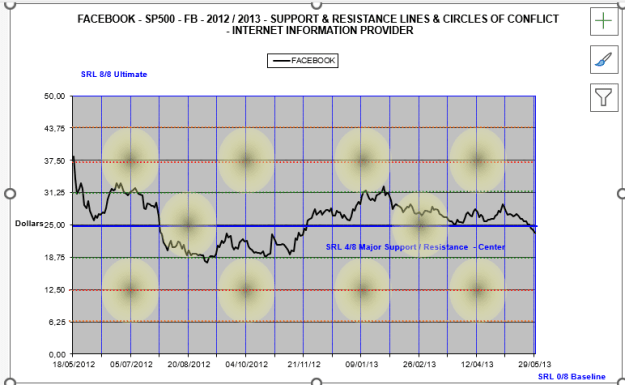
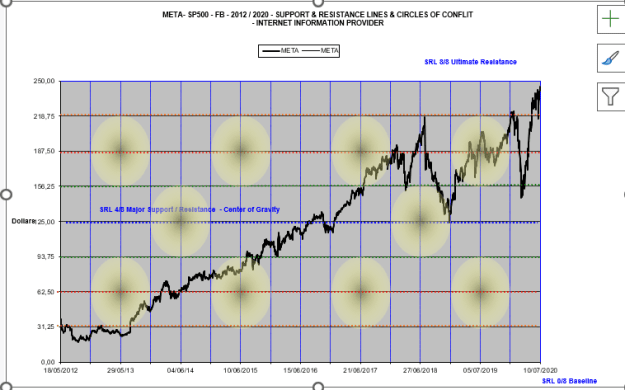
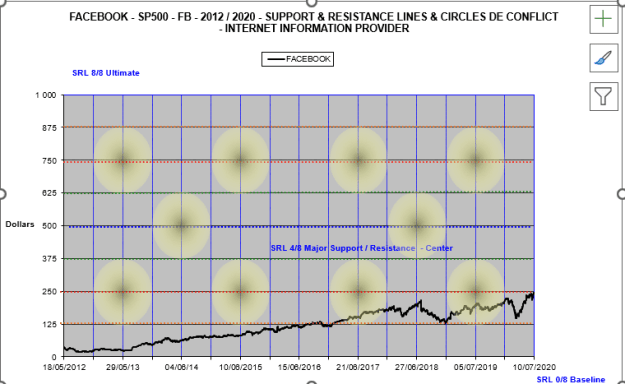
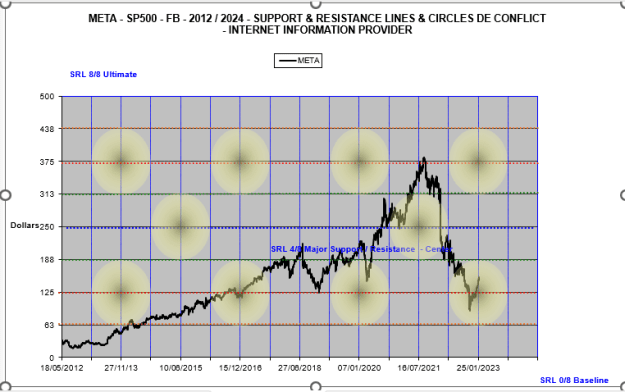
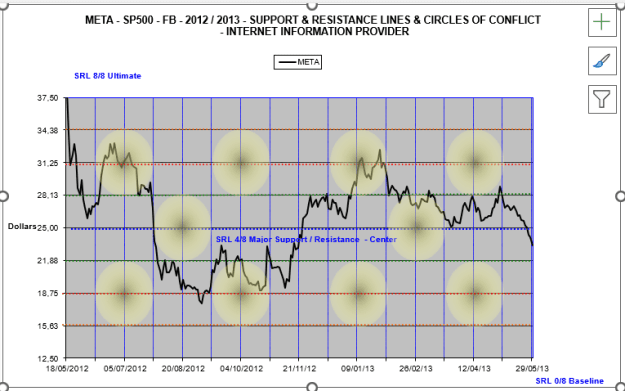
Hereunder you see a Facebook / Meta Chart 1 Year after its IPO
Price Range is similar 37.5 / 12.5 = 25
1 Year = 256 Trading Days = 8 x 32 Trading Days
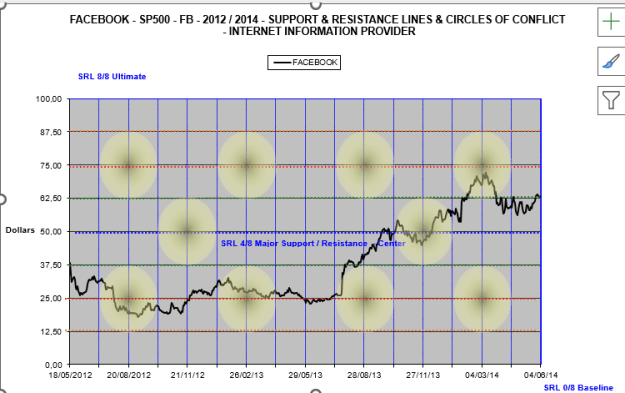
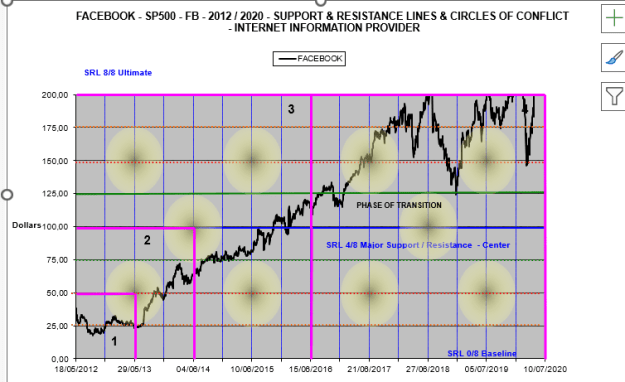
Price Range is similar 37.5 / 12.5 = 25
1 Year = 256 Trading Days = 8 x 32 Trading Days
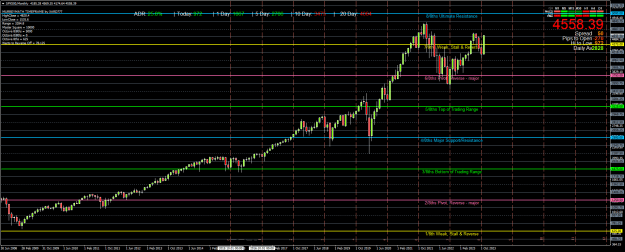
Attached Image (click to enlarge)
3