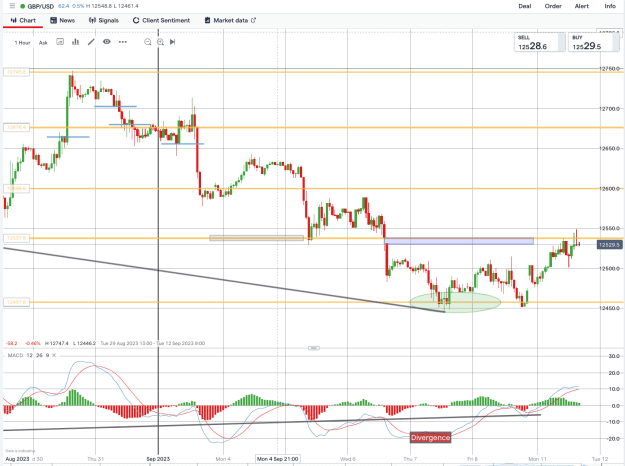
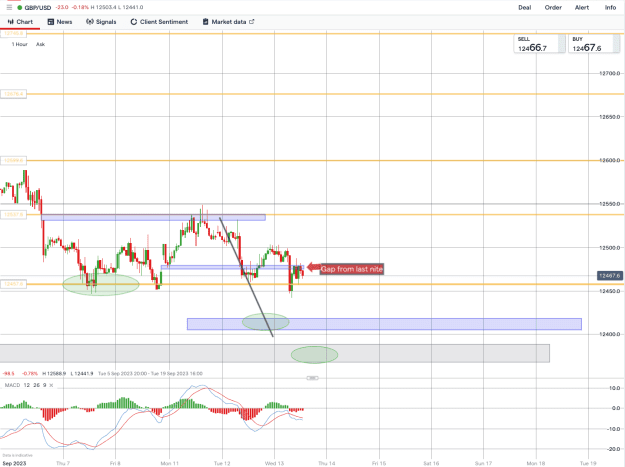
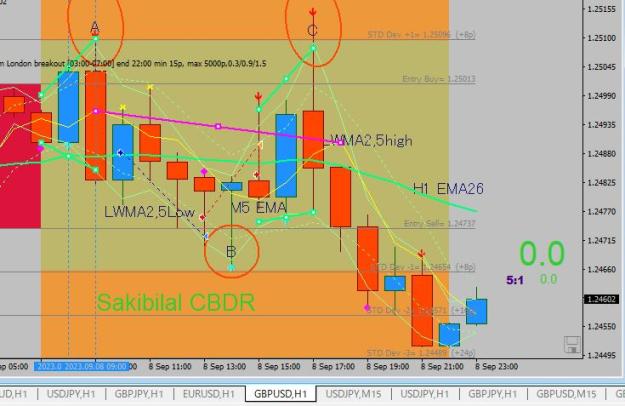
Friday 9/8 GU H1 chart review
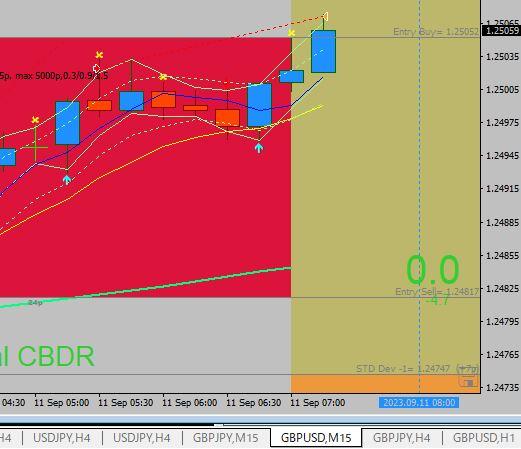
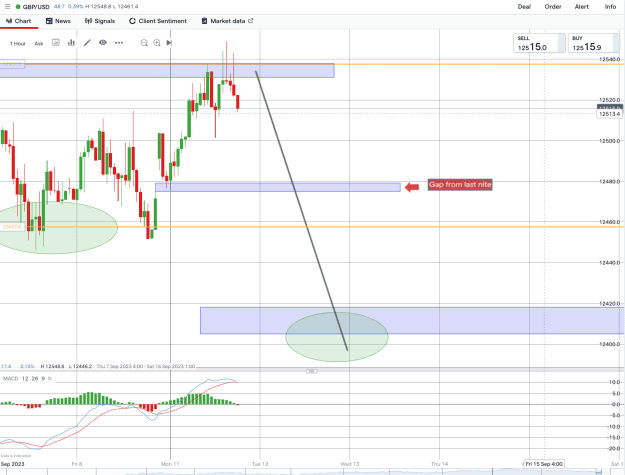
Thick and light green H1EMA26 moves almost horizontally, the price movement tends to fluctuate up and down, and the candlestick is long, making it a difficult environment for trading.
In chart technical terms, AC's W top broke below the bottom B point.
In A and C, the candles have the same height, but the yellow M5EMA is downward to the right. There is also a gap in the HighLow of the thin green LWMA, which suggests price movement.
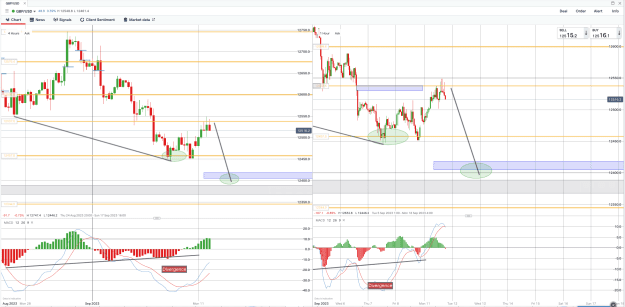
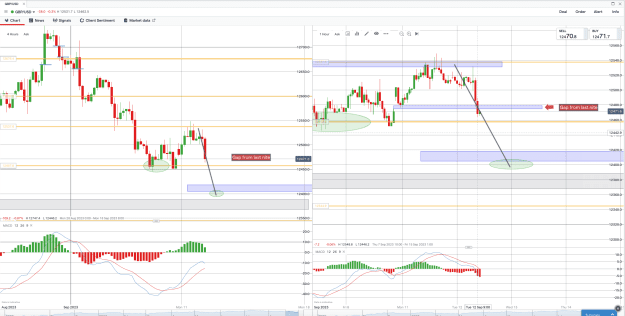
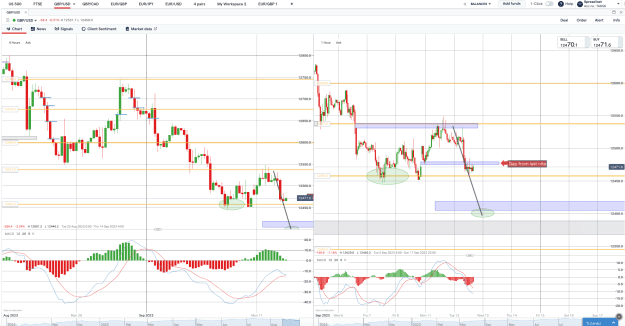
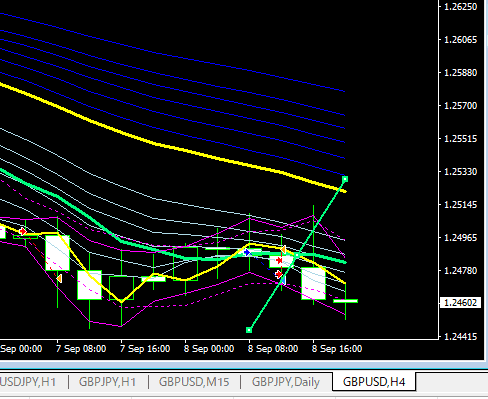
The second photo, H4GAMMA, may be easier to understand.
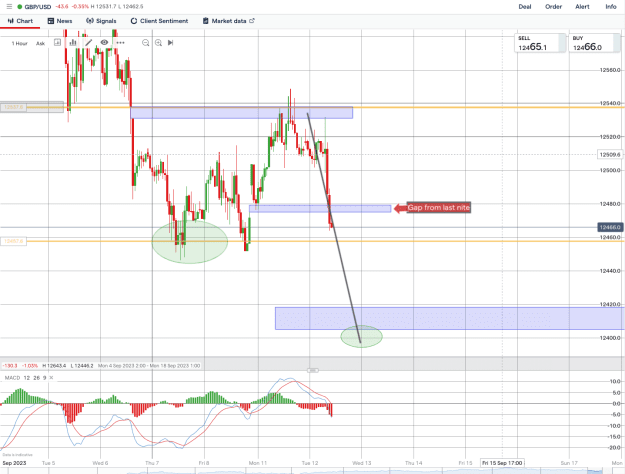
Thick and light green H1EMA26 moves almost horizontally, the price movement tends to fluctuate up and down, and the candlestick is long, making it a difficult environment for trading.
In chart technical terms, AC's W top broke below the bottom B point.
In A and C, the candles have the same height, but the yellow M5EMA is downward to the right. There is also a gap in the HighLow of the thin green LWMA, which suggests price movement.
The second photo, H4GAMMA, may be easier to understand.
Attached Image (click to enlarge)
Attached Image (click to enlarge)
1