NASDAQ Cycle Analysis
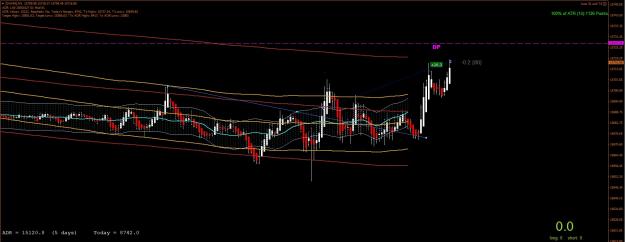
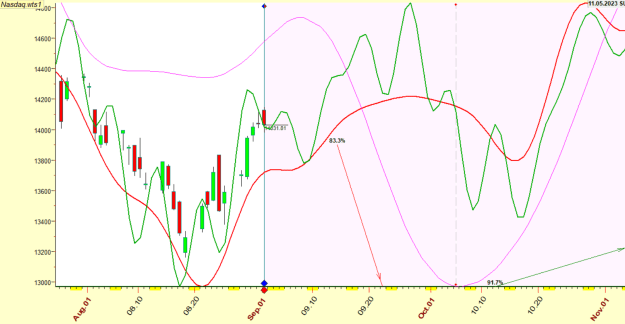
Updated NASDAQ cycles forecast is below:
Updated NASDAQ cycles forecast is below:
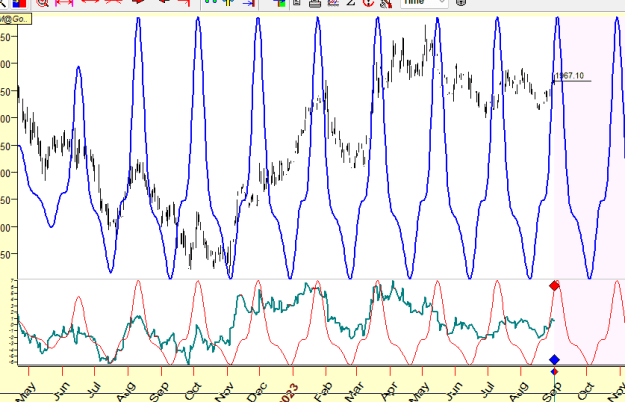
- Red line is the primary projection line
- Green line is shorter cycles
- Pink line is a seasonal pattern with arrows showing periods of strength and weakness with win rates
- Projection lines only show direction and timing of the moves, but not the magnitude or price
Key Observations:
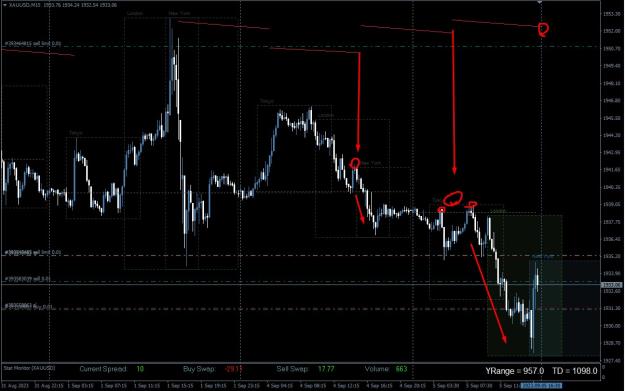
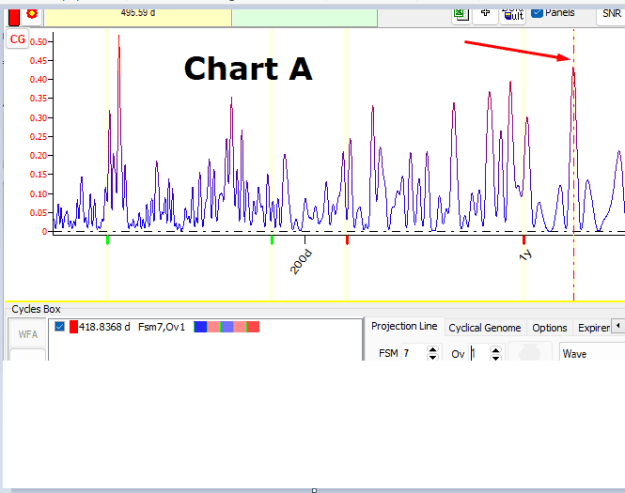
- I noted on Aug 19, that we have nested lows second half of August with several cycles (e.g. 58D, 20W, and 40W cycles) pointing to a significant low right ahead, likely around end of August-early September. It appears that August 18 was that low.
- All relevant cycles have thus been rising off that low. Two key cycles I am watching are 58 day and 74 day - both have projected peaks or secondary peaks mid-September and troughs mid-October.
- The set up for next two weeks is dip and rip, but it’s unclear how much upside the market has give all the headline risk ahead. We need to see market take out last week’s highs to keep momentum and then July highs to invalidate downside projections.
- Seasonality turns negative on September 15
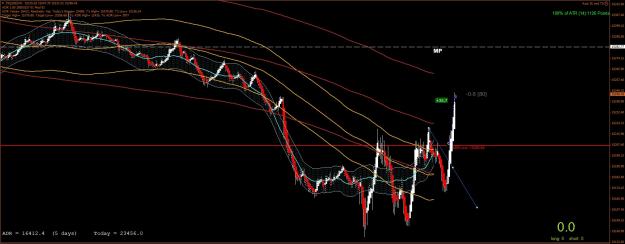
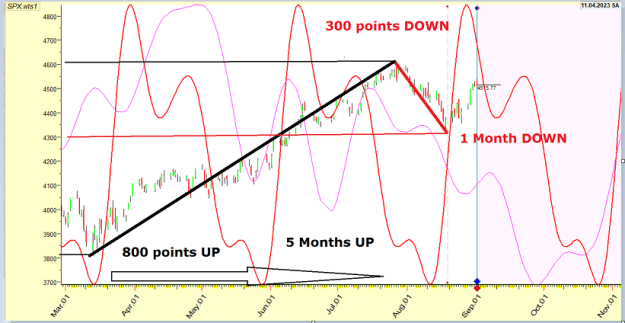
SP 500 Cycles Analysis
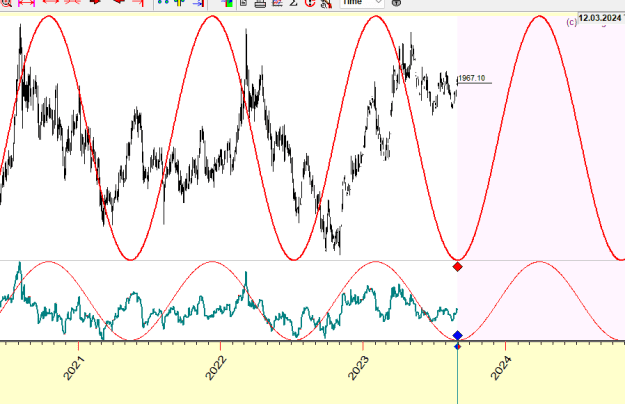
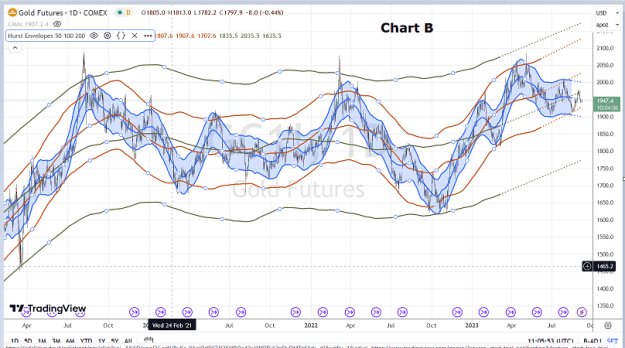
SPX cycle view is pretty much the same. Red line shows 80 day nominal cycle.
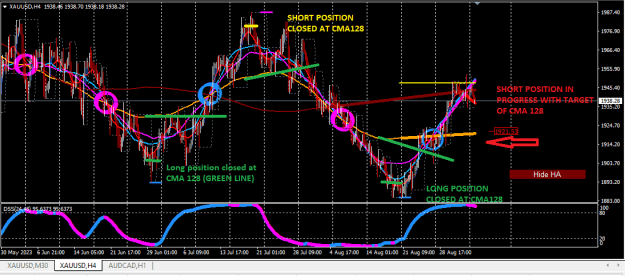
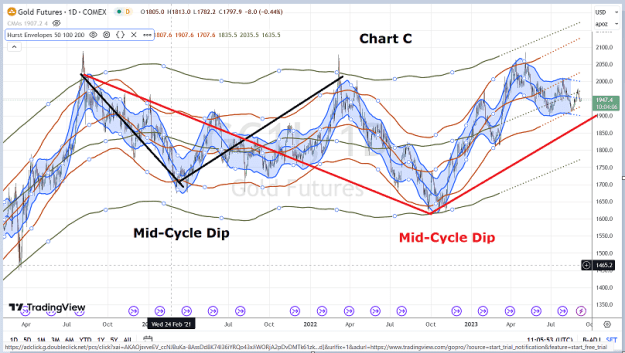
SP500 Chart shows once more that THE UNDERLYING TREND STRENGTH is the Key
In SP500 Case the underlying trend strength (amplitude) negates during 5 months all fluctuations/ oscillations of the Cycle (Frequency) shown by the Timing Solution software
Attached Image(s) (click to enlarge)
4