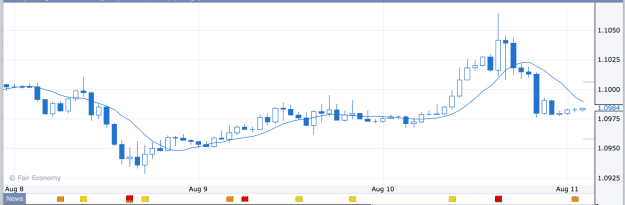
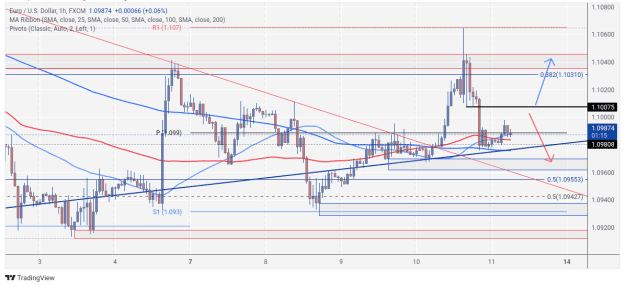
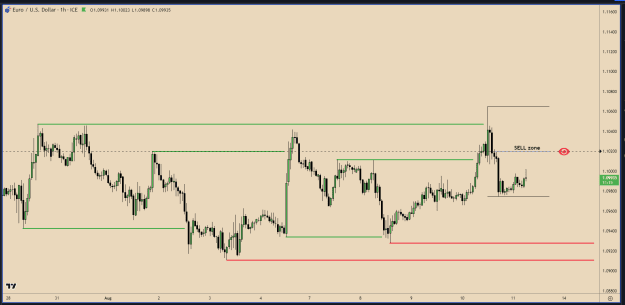
Disliked{quote} I agree with pedro319 on this. There are a few reasons like pedro319 just suggested. the "50" and "100" levels tend to gather support/resistance though I don't trade to them. If you look at the candles however in the green box, you can see the trend often stops at this level meaning it is a support / resistance structure and the trend has a reasonable chance of turning at this point. Put together with the Fibonacci on the current trend and it becomes a powerful tool. Hope this helps. Matt. {image}Ignored
A man has a mouse in his pocket.
1