Hi guys,
I am struggling with this chart posted by spud.
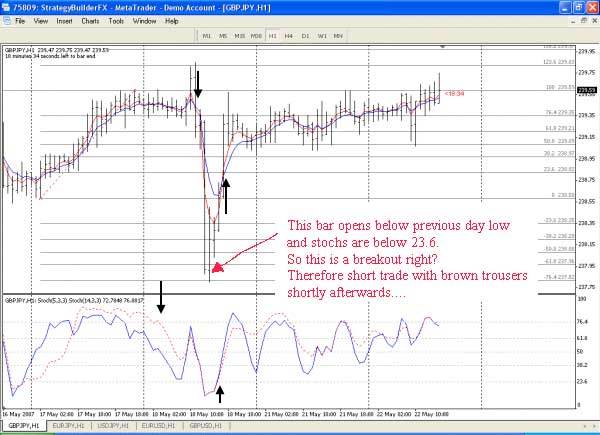
From what I can see: the price drops dramatically and retraces in the following bar. As the opening price (after the drop) is below the previous day low, and the stochs are both below the 23.6 mark, should this not dictate a short entry?
-I am looking at the chart in context of this thread (breakout system).
Am I missing the significance of the 2 x MA's?
If so please could someone enlighten me.
Regards
Paul.
I am struggling with this chart posted by spud.
From what I can see: the price drops dramatically and retraces in the following bar. As the opening price (after the drop) is below the previous day low, and the stochs are both below the 23.6 mark, should this not dictate a short entry?
-I am looking at the chart in context of this thread (breakout system).
Am I missing the significance of the 2 x MA's?
If so please could someone enlighten me.
Regards
Paul.