Happy Eid bro! Hope you enjoy the celebrations and finally an end to all the fasting for you!
Trades today went out at breakeven. I was holding for 3.5R on GU and EA and both ended at breakeven. I thought I saw a big range today but turned out to be similar to the rest of the week. Should have taken 1.5R in hindsight.
and i pray that religion is finally no longer a topic here on a forex forum...
Ignored
I think you are safe until next year :-)
I don't see any major issues with wishing someone during a major religious event, just as Xmas & Easter is widely celebrated here in the UK it's kind of the same with Eid for the Muslim world I think. Not that I'm an expert as it's the only muslim festival I've heard of. Nothing wrong with wishing someone well during a yearly religious event IMO. I can see why a more often re-occurrence might cause some disruption to a forum for forex but once a year is different IMO.
{quote} I think you are safe until next year :-) I don't see any major issues with wishing someone during a major religious event, just as Xmas & Easter is widely celebrated here in the UK it's kind of the same with Eid for the Muslim world I think. Not that I'm an expert as it's the only muslim festival I've heard of. Nothing wrong with wishing someone well during a yearly religious event IMO. I can see why a more often re-occurrence might cause some disruption to a forum for forex but once a year is different IMO.
Ignored
yes, this is a comprehensible argument.
trading is like dancing, don't think and just listen to the music!
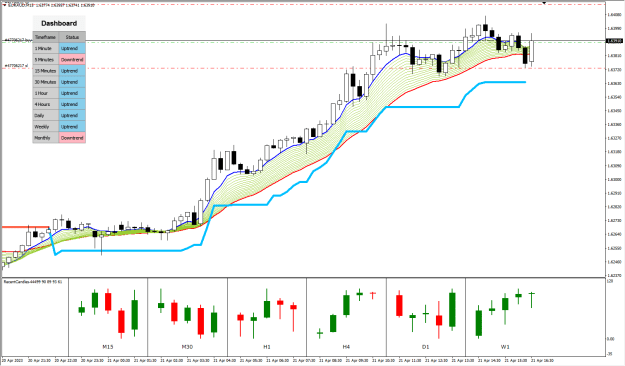
Direction looks clear on all TFs to me and saw momentum coming out of Asia. These are the kinds of entries I try and get and the minute price pushes in my favour I put the position to breakeven. Once at breakeven, it's either B/E or TP. My principle aim is capital protection and therefore winrate excluding the breakevens. I get a lot of trades where it comes and takes me out and goes to TP but I can't filter these from the ones it come down to my SL as this strategy is pure scalping for me so have very tight stops. The odds of the trade not finishing at breakeven just seems to depend on the momentum of the move. This one survived.
EA M1 Direction looks clear on all TFs to me and saw momentum coming out of Asia. These are the kinds of entries I try and get and the minute price pushes in my favour I put the position to breakeven. Once at breakeven, it's either B/E or TP. My principle aim is capital protection and therefore winrate excluding the breakevens. I get a lot of trades where it comes and takes me out and goes to TP but I can't filter these from the ones it come down to my SL as this strategy is pure scalping for me so have very tight stops. The odds of the trade not...
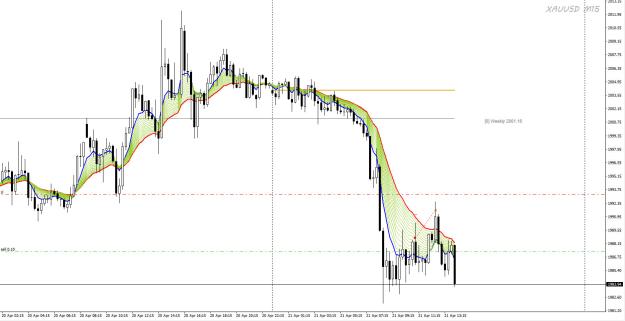
This looked almost identical to last Friday. Direction looked clear and before news there was a big push on M5. Last Friday it messed around until around this time NY session then just went and I thought it was doing the same. I thought a move down at this stage looking at the daily was highly unlikely but it looks like it may hit my SL here.
EA Part 2 This looked almost identical to last Friday. Direction looked clear and before news there was a big push on M5. Last Friday it messed around until around this time NY session then just went and I thought it was doing the same. I thought a move down at this stage looking at the daily was highly unlikely but it looks like it may hit my SL here. {image}
Ignored
SL.
The SL on this was larger than I would have liked but it looked decent to me. Was unable to put the SL to breakeven on this trade.
{quote} Look at gold now, you were unlucky. Gold was very very very tricky this week. Random moves until some random news then impossible to enter moves.
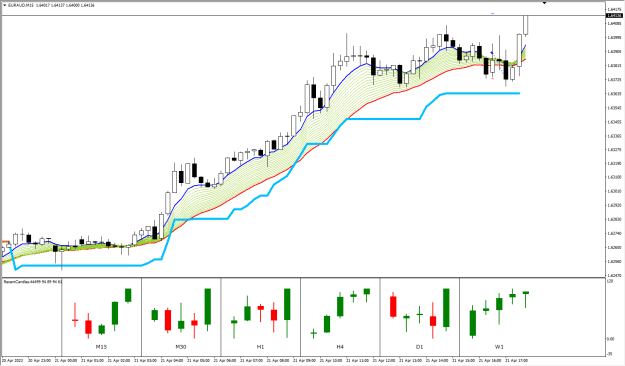
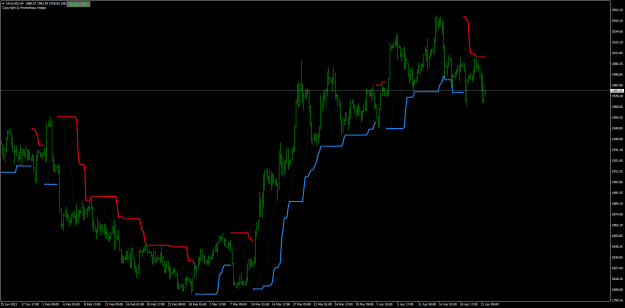
Lines are limits of supertrend indicator. If you are trading this as it should be traded, your SL should trail these lines. It's similar to a donchian channel but more advanced. You would need to have a look at the calculations to really understand how it works but all you really need to know is it's a volatility adjusted donchian channel.
{quote} https://www.forexfactory.com/thread/...7#post14392237 Lines are limits of supertrend indicator. If you are trading this as it should be traded, your SL should trail these lines. It's similar to a donchian channel but more advanced. You would need to have a look at the calculations to really understand how it works but all you really need to know is it's a volatility adjusted donchian channel.
Ignored
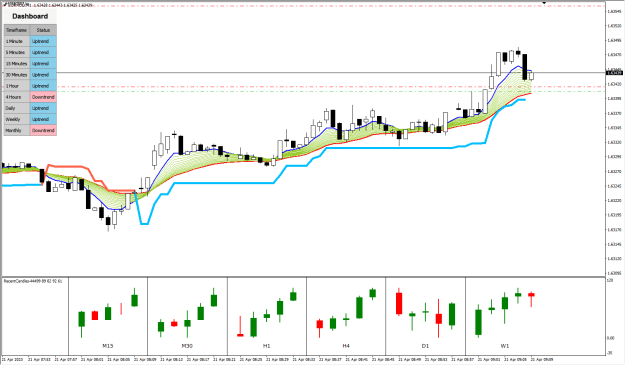
This is a good indicator to place a stop and understand multiple time frame trend directions in one chart.
MA provides the market's current direction and strength.