Disliked{quote} Based on this before any up move we should fill that fvg to 1.16 level?Ignored
but we did not know it will drop to what level.
you would have already drawn the fvg in the monthly chart.
but you still did not know drop to what level because it was a large range.
then you have to analyse the rest of the smaller time frames one by one.
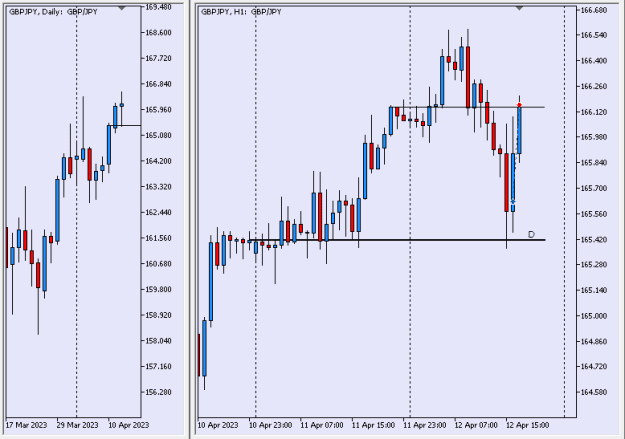
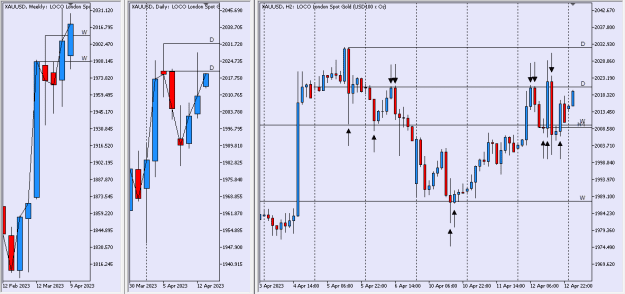
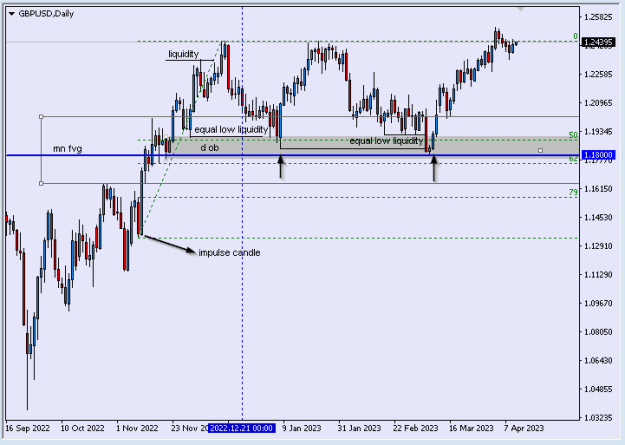
the daily chart provided some clues.
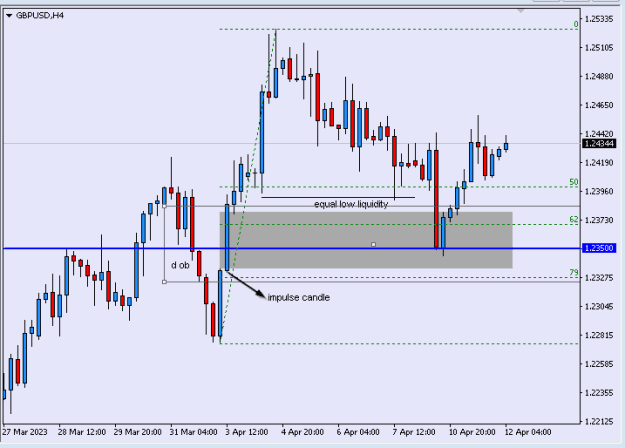
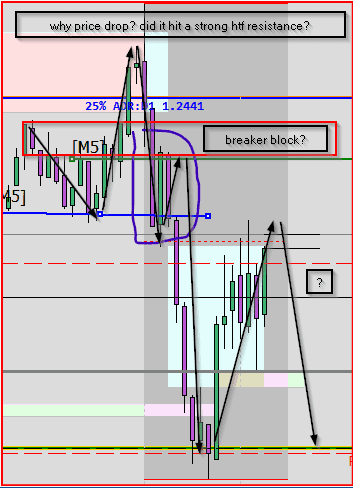
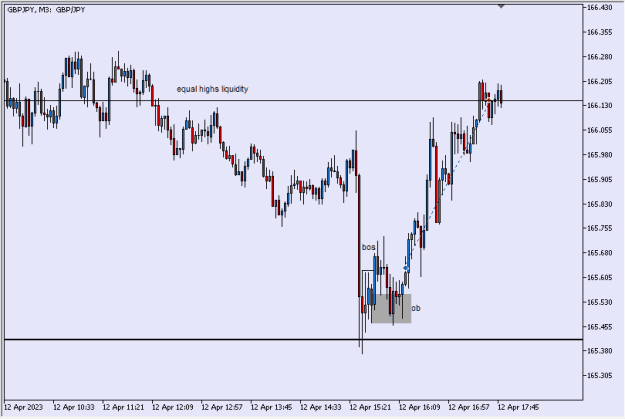
what are the supporting reasons for the 1st bounce?
mn fvg, equal low liquidity, d ob in a discount market.
the 2nd bounce also had the same reasons for the 1st but with added confidence of round number 1.18.
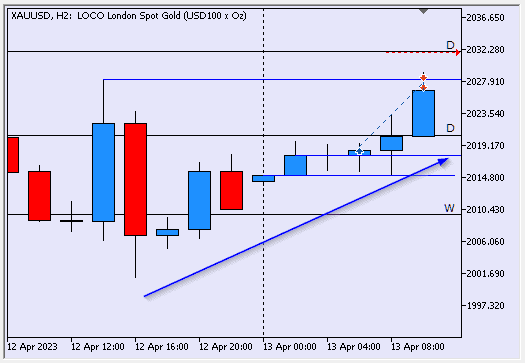
you see the d candles closing above mn fvg and d ob.
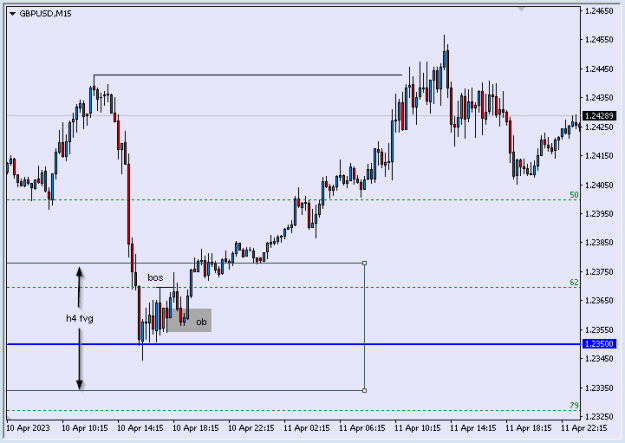
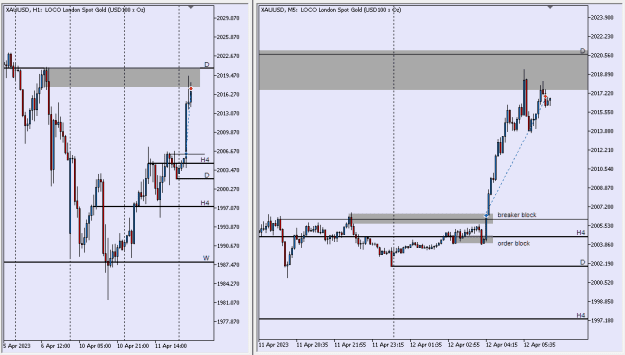
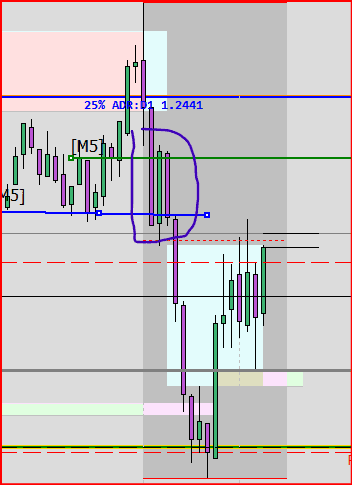
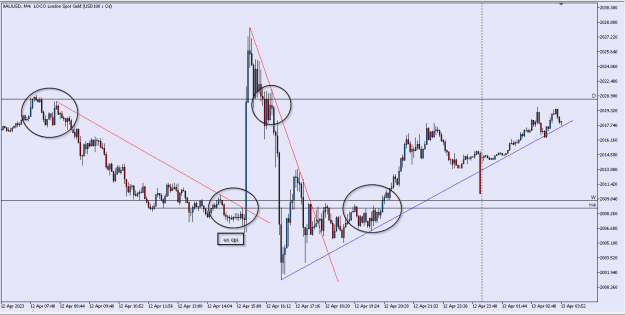
then the smaller time frames each has a story line to tell, depending on how low you want to get.
Attached Image (click to enlarge)
ITB - Seeing Orderliness amongst 'Randomness'
2