• Home
  • Forums
  • Trades
  • News
  • Calendar
  • Market
  • Brokers
  • Login
  • Join
  • User/Email: Password:
  • 11:22pm
Menu
  • Forums
  • Trades
  • News
  • Calendar
  • Market
  • Brokers
  • Login
  • Join
  • 11:22pm
Sister Sites
  • Metals Mine
  • Energy EXCH
  • Crypto Craft

Options

Bookmark Thread

First Page First Unread Last Page Last Post

Print Thread

Similar Threads

Dreamliners’ MPAS (Mechanical Price Action Strategy) System 485 replies

Percentage vs. Pips per Trade vs. Pips per Day/Hour! 7 replies

MACD_Colored Indicator for 4 Hour Strategy (300+ Pips per Month) 157 replies

my MT4 have a stroke? 2 replies

  • Rookie Talk
  • /
  • Reply to Thread
  • Subscribe
  • 18
Attachments: Two-Stroke System (Mechanical Price Action +300 pips per month)
Exit Attachments

Two-Stroke System (Mechanical Price Action +300 pips per month)

  • Last Post
  •  
  • Page 1 2345 6
  • Page 1 234 6
  •  
  • Post #1
  • Quote
  • First Post: Jul 19, 2007 4:57am Jul 19, 2007 4:57am
  •  Inflection
  • | Joined Jun 2007 | Status: Member | 69 Posts
PLEASE NOTE: This is a work in progress. I welcome your comments, criticisms, and improvements!

This approach is ultra simple. It is based only on price action and probabilities. It uses no predictions, no charts, and no discretion. It can be completely automated.

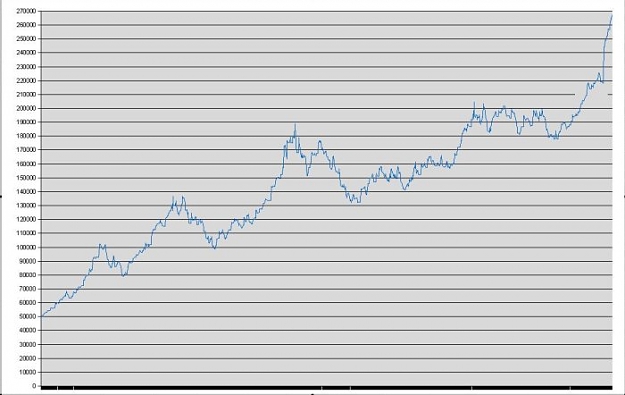
I have run historical studies using this approach from 2003-2007 on ten major pairs and the returns are positive across the board. It is probably applicable to other pairs as well, though I have not done any studies on exotics.

From these historical studies, I selected two pairs with a low correlation and a low risk/reward ratio for this system: EURUSD & USDCAD.

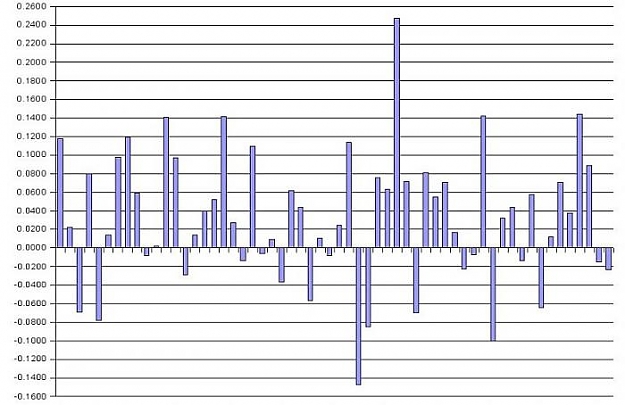
Trading these pairs in tandem with this approach would have returned more than 300 pips per month over the past 5 years.

I will describe the approach, trading rules, and risk management in separate posts.

All the best!
  • Post #2
  • Quote
  • Jul 19, 2007 5:02am Jul 19, 2007 5:02am
  •  smjones
  • Joined Mar 2006 | Status: THANK YOU MERLIN,TWEE and FF Team | 4,603 Posts
I look forward to it. I like the way your thought processess work. It is refreshing to see someone who starts with the premise that they may be wrong to begin with. It gives the scientific approach a chance...


thanks much
  • Post #3
  • Quote
  • Jul 19, 2007 5:17am Jul 19, 2007 5:17am
  •  neel123
  • | Joined Mar 2007 | Status: Member | 42 Posts
Cant wait for it. Hope you are typing as we speak.
  • Post #4
  • Quote
  • Edited at 1:16pm Jul 19, 2007 5:19am | Edited at 1:16pm
  •  Inflection
  • | Joined Jun 2007 | Status: Member | 69 Posts
I call this the "two-stroke system" because it is like a two-stroke engine, with a compression cycle and a combustion cycle. Two-stroke engines are small, simple and powerful. They are much less complex than big four-stroke engines, but they are also not as efficient. Likewise, this system seems at first blush to be a winner. It has an edge with small, consistent gains over time, but it also has lots of small losses. It's not a humongous winner, so don't think about getting rich while you sleep :-) Nevertheless, a few hundred pips a month is just fine with me, if it works as I think it might.

Basically, this system involves taking two positions in each pair, but each position is managed differently. One position is for taking advantage of daily price action (the compression cycle). The other position is for engaging and following the trend (the combustion cycle).

It is very tough to develop systems that perform well in both ranging and trending markets. Likewise, it is extremely difficult to predict the trend. Indicators lag the market, so that by the time the trend can be identified, it is already engaged. Riding the trend is fine, but the value of getting into the trend early - even a day or two early - can be hugely significant.

The solution to the paradox is not prediction, but participation.

By this I mean if you are constantly in the market, and you have a means to identify emerging trends, then you have a chance to maximize your opportunities to participate in the trend.
  • Post #5
  • Quote
  • Jul 19, 2007 5:45am Jul 19, 2007 5:45am
  •  Dexis
  • | Joined Nov 2006 | Status: Member | 345 Posts
Hello, and thanks for sharing your system here on FF

Looking forward to reading more information.
  • Post #6
  • Quote
  • Jul 19, 2007 6:06am Jul 19, 2007 6:06am
  •  Inflection
  • | Joined Jun 2007 | Status: Member | 69 Posts
Okay, as I said this involves only price action and probabilities.

We have our two pairs - EURUSD & USDCAD - and we are trading on the daily timeframe.

1. I choose a trade side, either LONG or SHORT. I looked at the probability of any given day closing higher or lower. Actually, it's not 50%/50%. It's higher. It's not a huge difference, but it's there, like 53%/47%. So, on average EURUSD has more up days than down days, and USDCAD has more down days than up days. I am only trading on ONE side, the side with the higher probability. So I will be going LONG on EURUSD and SHORT on USDCAD.

2. I enter at the open with two positions. Assume the trade side is LONG (reverse the rules for SHORT). If the close of the day is less than the open or less than the previous close, then EXIT the position at the close; otherwise, HOLD the position. This basically keeps you in the position if the price continues to close higher. This simple strategy is profitable, but the real power is that it keeps you in the market, already holding a position, when a trend emerges.

3. I let one position run when a trend emerges. I am using the Wm%R oscillator, which measures the closing price in relation to a recent high-low range. This kind of indicator is in sync with the approach we are using for daily price action, because each is looking at the same thing: higher or lower closes. As long as %R gives a signal, I let this position run. On the day the signal fails, EXIT at the close.

4. While the trend is engaged, I re-enter at the next open with only one position (if the prev was an EXIT), so that I always have two positions in the market. If there is no trend signal, then I re-enter at the next open with two positions, as in rule #2.

Here's a quick summary.

Use the following settings for Wm%R:
Wm%R 30-day
Threshold 30% & 70%

EURUSD

1. Enter LONG at the open of the day with 2 positions.
2. If %R indicates an UP trend just before the close, hold 1 position.
3. If the day will close lower than the open or prev close, then exit one or both positions.
4. If the day will close higher than the open and prev close, then hold one or both positions.
5. If the prev bar was an EXIT, re-enter at the open of the next bar with 1 or 2 positions.

USDCAD

1. Enter SHORT at the open of the day with 2 positions.
2. If %R indicates a DOWN trend just before the close, hold 1 position.
3. If the day will close higher than the open or prev close, then exit one or both positions.
4. If the day will close lower than the open and prev close, then hold one or both positions.
5. If the prev bar was an EXIT, re-enter at the open of the next bar with 1 or 2 positions.
  • Post #7
  • Quote
  • Jul 19, 2007 6:45am Jul 19, 2007 6:45am
  •  ChowClown
  • | Joined Sep 2006 | Status: Member | 944 Posts
Inflection, many thanks for posting your idea. Do you determine W%R failure when it breaks through the 30/70% thresholds?
  • Post #8
  • Quote
  • Jul 19, 2007 6:46am Jul 19, 2007 6:46am
  •  Inflection
  • | Joined Jun 2007 | Status: Member | 69 Posts
You don't really need a chart to plot Wm%R. You can do everything on a spreadsheet, which is what I did. But if you do plot it on a chart, it's easier to see if you use it as a paintbar study on top of the chart rather than an oscillator under your chart. I've attached a screenshot of what this looks like in my charting program.

If you're not familiar with this, Wm%R is an oscillator which measures the closing price in relation to the recent high/low range. If we choose a range such as the past 30 days for example, then this oscillator would tell us from 0%-100% how the closing price compares to the high/low range of the past 30 days, whether very close to the top, very close to the bottom, or somewhere in between. You set threshholds for Wm%R, such as 30% and 70%, so beyond these %ages, you might consider a "buy" zone or a "sell" zone. And if you use that as a paintbar study, it will look like the attached image, with green bars, red bars, and yellow bars.

The formula is as follows:

Wm%R = 100 * (Hr - C) / (Hr - Lr)

r = time frame (e.g. 30 days)
Hr = highest high during this timeframe
Lr = lowest low during this timeframe
C = latest close

It ranges from 0% (max) to 100% (min). When you choose a threshhold range (e.g. 30% & 70%), then everything under 30% is UP, everything above 70% is DOWN, and everything in between is FLAT. That's how I got the green, red, and yellow bars.
Attached Image (click to enlarge)
Click to Enlarge

Name: screen.jpg
Size: 56 KB
  • Post #9
  • Quote
  • Jul 19, 2007 6:49am Jul 19, 2007 6:49am
  •  ChowClown
  • | Joined Sep 2006 | Status: Member | 944 Posts
...great, thanks.
  • Post #10
  • Quote
  • Jul 19, 2007 7:00am Jul 19, 2007 7:00am
  •  Inflection
  • | Joined Jun 2007 | Status: Member | 69 Posts
Attached is a sample of the spreadsheets I used for my historical studies. I have been known to completely overlook really important and obvious things, so I am posting this here with great fear and trepidation.

Go easy on me :-)

The column headers may need some explanation:

STAT = signal to HOLD or EXIT for the day
ENTRY = entry price (for HOLDovers)
TREND = Wm%R signal
ENTRY = entry price (for TREND position)
BASE = gain from daily price action (HOLD/EXIT)
XTEND = gain from trend position

If I have punched in the numbers correctly, here are some stats from the study for the EURUSD/USDCAD tandem:

Total gains 2003-2007: 18,206 pips
Average per month: 302 pips
Winning days: 46%
Maximum single day loss: -580 pips

I have also attached a chart showing the distribution of monthly returns. Obviously, the majority are positive. And obviously, there are a couple big losers.

I'll write about what I'm thinking for money management in the next post.
Attached Image (click to enlarge)
Click to Enlarge

Name: gains.jpg
Size: 53 KB
  • Post #11
  • Quote
  • Jul 19, 2007 7:07am Jul 19, 2007 7:07am
  •  Inflection
  • | Joined Jun 2007 | Status: Member | 69 Posts
Here is the spreadsheet.
Attached File
File Type: zip 2STROKE_SYSTEM_EURUSD_USDCAD.zip   429 KB | 2,224 downloads
  • Post #12
  • Quote
  • Jul 19, 2007 7:13am Jul 19, 2007 7:13am
  •  Inflection
  • | Joined Jun 2007 | Status: Member | 69 Posts
Obviously, if you're doing this manually, your exits and entries will be a few minutes after the open of the next bar, since you need to see what your signals are at the close. Otherwise, you can calculate or chart your signals a few minutes before the close and enter at the open. Either way, your average price for exits and entries should end up being close to the actual close/open because sometimes it will be higher, sometimes lower.
  • Post #13
  • Quote
  • Jul 19, 2007 7:15am Jul 19, 2007 7:15am
  •  smjones
  • Joined Mar 2006 | Status: THANK YOU MERLIN,TWEE and FF Team | 4,603 Posts
Wow, It looks like you could be on to something here. This is very interesting. Did you enter all these trades by hand or did you use some sort of DDE fill? If you entered them by hand, it would be obvious that you actually checked each one for validity.
  • Post #14
  • Quote
  • Jul 19, 2007 7:50am Jul 19, 2007 7:50am
  •  rogerha
  • | Joined Aug 2006 | Status: Member | 240 Posts
This definitely has the makings of something positive here. My initial comment pertains to the apparent lack of a stop loss, which means it will take some 'bravery' to run with this at times I suspect. I also suspect as soon as you engage some sort of stop loss, your results might skew considerably.
  • Post #15
  • Quote
  • Jul 19, 2007 7:55am Jul 19, 2007 7:55am
  •  Inflection
  • | Joined Jun 2007 | Status: Member | 69 Posts
Okay, here goes my attempt at risk management. Please be aware that I am a Forex newcomer. I am still learning my way into this stuff. I reserve the right to disagree with myself :-)

The first and most important thing to note is that I have not put any stops into this system. I have tried to present something as simple as possible, without a lot of extra rules or constraints or filters.

This does not mean that this system should be traded without stops. It's just that stops are more complicated to test because while they limit your losses, they also have the effect of limiting your gains (because some %age of trades will hit the stop and then turn around ... arrgghh!). You have to test in smaller timeframes. Anyway, I'll continue to put some thought into this. For now, we can look at the system without trade stops and see how we might manage risk.

Also, before I start, I feel somewhat compelled as a reminder to myself and to everyone else, that the simplest way to manage risk is not to trade.

If you are in debt, do not have an emergency fund in the bank, are paying high rent instead of a mortgage, and are not trading with money that you can afford to lose without risking your marriage or ending up in crisis ... then you are already risking too much! Don't trade. Boost your income. Save money. Papertrade. The market is not going away. It will still be here.

Now where was I before truth broke in ...
  • Post #16
  • Quote
  • Edited at 9:13am Jul 19, 2007 8:59am | Edited at 9:13am
  •  Inflection
  • | Joined Jun 2007 | Status: Member | 69 Posts
Ah... the money management.

I am using an equal equity risk management model, which attempts to always keep a certain %age of my total equity at risk.

I hope I am doing this correctly:

1. Estimate the maximum risk of this system

The biggest single losing day in recent history for this system as described is about -580 pips. That's a biggie. That has happened only once. But we should assume that it could be even bigger in the future. Let's assume a ridiculously high 1000 pips.

2. Determine %equity risk

The maximum I am willing to lose on any single day is 10% of my equity. That's 5% for each pair. This is aggressive. It would be better to risk only 1% or 2% per pair. I will come back to this later with a 5% risk model, but let's assume 10% for now.

This 10% is an "equity stop" which means that if on any given day my loss reaches -1000 pips, then I am out of the market.

3. Calculate the risk position size

Account = $100,000
%eq risk = 10% = $10,000
Max loss = 1000 pips

Risk position size = $10,000 / 1000 = $10 per position

My combined risk ($10,000) is equal to the product of my combined pip loss (1000 pips across all positions) and the pip value per position ($10).

If I have a broker that allows very granular position sizes (such as Oanda), then I can maintain a constant equity risk. As my equity grows, so does the value per position. My position size grows accordingly.

4. Calculate the pip value per pair

EURUSD
1 lot = 100,000 EUR
.0001 = min movement
1.3800 = current rate
pip (per lot) = .0001 / 1.3800 * 100,000 = 7.25 EUR
7.25 EUR * 1.3800 (USD per EUR) = 10 USD

USDCAD
1 lot = 100,000 USD
.0001 = min movement
1.0487 = current rate
pip (per lot) = .0001 / 1.0427 * 100,000 = 9.59 USD

5. Calculate the # of lots per position ($10 pip per position).

$10 / $10 = 1 LOT EURUSD
$10 / $9.59 = 1.04 LOT USDCAD

2 pairs x 2 positions per pair
= 2 LOTS EURUSD
= 2.08 LOTS USDCAD

4.08 LOTS TOTAL

6. Calculate leverage

2 lots x 100,000 EUR X EURUSD = $276,000 (for EURUSD)
2.08 lots X 100,000 USD = $208,000 (for USDCAD)
TOTAL = $484,000 = 4.8X EQUITY

.: The $100,000 is controlling $484,000 = 4.8x leverage. Anything around 5x leverage is conservative and professional. But a higher leverage is not necessarily bad. It just depends.

7. Calculate margin risk

Let's pick some rates, such as those offered by Oanda, and assume the following:

Margin = 50:1
Initial margin rate = 2%
Maintenance margin rate = 1%

2% initial margin means that for a $100,000 contract, I must put up $2000.

2 lots X $2000 X EURUSD = $5520 (for EURUSD)
2.1 lots X $2000 = $4160 (for USDCAD)
.: TOTAL = $9680

Used margin = $9680
Usable margin = $90,320

$90,320 / $10(pip value) = 9032 pips combined loss = margin call

But since the maintenance margin rate is only 1% then I have some extra room as well.

2% margin = $9680 combined
1% margin = $9680 / 2 = $4840

Usable margin = $100,000 - $4840 = $95,160

$95,160 / $10 = 9516 pips combined loss = margin call

So the chances of a margin call are pretty much zero, since my equity risk and position size is constantly adjusted to the size of my account. This doesn't mean a string of gigantic losses won't obliterate the account. It just means I won't get a margin call.

Since I don't really need this much margin I have the option to put less money in the trading account and put the balance of cash elsewhere. My %equity risk is still factored from the overall amount, but I don't have to leave the cash just sitting for a nonexistent margin call. I can put it somewhere else useful.

I could also put half as much in the account, reduce my risk to 5% of total equity, and end up with a more modest $5 per pip value. But even in this case, if I constantly scale my equity risk and position size (though practically this may not always be possible), then over the past 5 years the return comes out to 45% per year. I have attached a chart showing the growth in equity assuming a constant (daily) adjustment for equity risk and position size.

I hope I did that right.
Attached Image (click to enlarge)
Click to Enlarge

Name: equity.JPG
Size: 41 KB
  • Post #17
  • Quote
  • Jul 19, 2007 9:00am Jul 19, 2007 9:00am
  •  BeachBum
  • Joined Oct 2005 | Status: Trade the MAX System with me... | 1,995 Posts
Hello inflection............

I've decided to follow you here from the "Stupid" thread. So far, very interesting. Thanks!
  • Post #18
  • Quote
  • Jul 19, 2007 9:24am Jul 19, 2007 9:24am
  •  Trader888
  • Joined Jun 2007 | Status: Member | 56 Posts
Quoting Inflection
Disliked
Ah... the money management.


I could also put half as much in the account, reduce my risk to 5% of total equity, and end up with a more modest $5 per pip value. But even in this case, if I constantly scale my equity risk and position size (though practically this may not always be possible), then over the past 5 years the return comes out to 45% per year. I have attached a chart showing the growth in equity assuming a constant (daily) adjustment for equity risk and position size.

I hope I did that right.
Ignored

If I am interpreting your equity curve correctly it looks like after the first time you hit the 190,000 level you don't make any significant high until right at the end of your EC? So for the last about 3 years the nett made on your equity curve was about 30,000? Is my interpretation correct? I am asking because I have drawn many such curves and always look at the period of time that elapse between a high and the next high. The curve might look nice and upward trending but infact is not. What does your curve look like if you start the chart at the 190,000 high? Just hold your hand over the left part of the chart...That gives you the timeperiod you will have to rely on other sources of income, if you are a "small" trader of course.

I hope my post is clear.
  • Post #19
  • Quote
  • Jul 19, 2007 9:49am Jul 19, 2007 9:49am
  •  ChowClown
  • | Joined Sep 2006 | Status: Member | 944 Posts
Inflection - certainly a method I would be tempted to trade with $100k+ initial equity to make it worthwhile within a longer term portfolio, given the risk parameters.

Thank you for the quality and clarity of your posts so far.

Good trading.
  • Post #20
  • Quote
  • Jul 19, 2007 10:29am Jul 19, 2007 10:29am
  •  Inflection
  • | Joined Jun 2007 | Status: Member | 69 Posts
Quoting Trader888
Disliked
If I am interpreting your equity curve correctly it looks like after the first time you hit the 190,000 level you don't make any significant high until right at the end of your EC? So for the last about 3 years the nett made on your equity curve was about 30,000? Is my interpretation correct? I am asking because I have drawn many such curves and always look at the period of time that elapse between a high and the next high. The curve might look nice and upward trending but infact is not. What does your curve look like if you start the chart at the 190,000 high? Just hold your hand over the left part of the chart...That gives you the timeperiod you will have to rely on other sources of income, if you are a "small" trader of course.

I hope my post is clear.
Ignored
Trader888 -

Yes, your post is absolutely clear, and totally correct.

Drawdowns in the equity curve stink. As we can see from the chart showing distribution of monthly returns, the big losing months tend to cluster, two or three in a row. While 67% of the months were winners with an overall average of +300 pips, 2005 would still have been a losing year.

The good news is that this system is not optimized at all. As it stands, it is a brute force, stupid system, without any intelligent stops or exit strategies.

In my opinion, that is where real improvements can be made, and that is where we can all help each other.

All systems have three important components:

1. Selection (markets, timeframes, etc.)
2. Trading rules (entries, exits, etc.)
3. Risk management (positions, risk, stops, etc.)

As it is, this is an overtly simple system. But if I have done the numbers correctly, then it can stand on its own. What remains is to find smart ways to improve it in any or all of these three areas.

What do you think? Is there potential here?
  • Rookie Talk
  • /
  • Two-Stroke System (Mechanical Price Action +300 pips per month)
  • Reply to Thread
    • Page 1 2345 6
    • Page 1 234 6
0 traders viewing now
  • More
Top of Page
  • Facebook
  • Twitter
About FF
  • Mission
  • Products
  • User Guide
  • Media Kit
  • Blog
  • Contact
FF Products
  • Forums
  • Trades
  • Calendar
  • News
  • Market
  • Brokers
  • Trade Explorer
FF Website
  • Homepage
  • Search
  • Members
  • Report a Bug
Follow FF
  • Facebook
  • Twitter

FF Sister Sites:

  • Metals Mine
  • Energy EXCH
  • Crypto Craft

Forex Factory® is a brand of Fair Economy, Inc.

Terms of Service / ©2021