Attached Image (click to enlarge)
The Secret to Trading:
Before you even start learning to trade, see below the Secret question of trading:
Yes there is a secret trick ! but rarely people believe that it is the real secret. People think important is the method but it is not the method it is the secret + method without the secret no method will be successful.
1. The Secret:
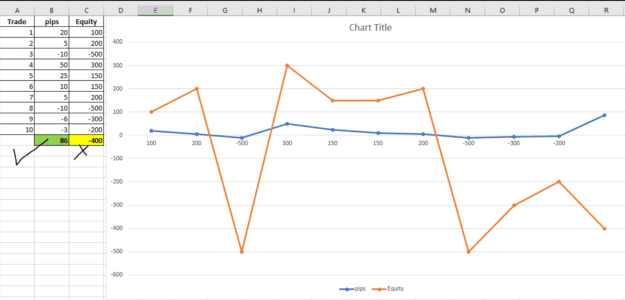
what should be the comfortable loss per trade and how it shapes the Equity?
Loss per trade:
10% allows only 10 trades
5% allows only 20 trades
3% allows only 33 trades
2% allows only 50 trades
1% allows only 100 trades
if you have to choose your comfortable % from above one ! which one you will ?
what is the % of loss of equity/capital (not pips/amount) we willing to lose from all our equity? what % it will be from our equity lost is the secret.
Unfortunately we dont use SL and assume price has to respect my entry always.
Q: Do you want to be right or do you want to be Happy ?
Trading is such that at times losing is winning itself, keep your goal in focus i.e., secure your equity.
now ask again do you want to be right or do you want to be happy.
use stop loss !!!
if you have the answer of above question, you will not need to ask how many pips will be my SL because the lot size will be choose by the EA i shared in post # 1 because your loss is fixed in terms of amount.
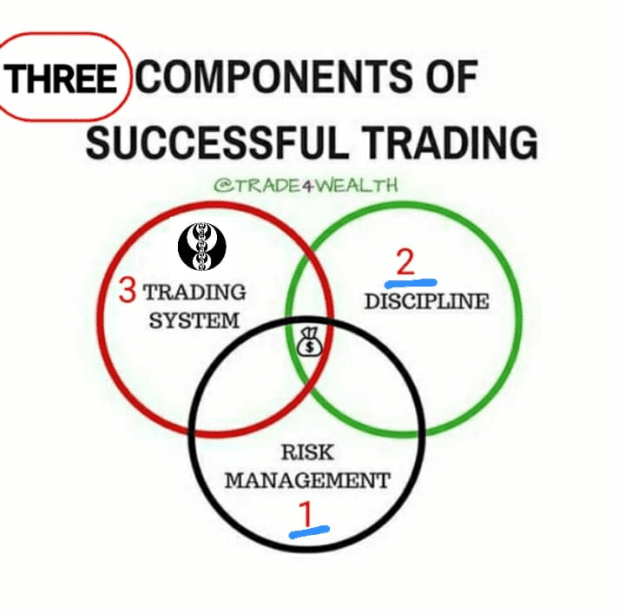
now if risk management is in place which needs alot of discipline, we move to part # 2
2. How to develop discipline:
Inserted Video
Use any prop firm demo account i.e. ftmo / mff to learn and practice that, only doing demo practice without any rules or discipline can only verify the method but with proper discipline one has to take challenges but unfortunately no one told me this but
Once we have the discipline trust me investors will be on your left and right people have funds but not skilled traders available, and at the least you can always use your own funds as the journey has taught us how to trade.
Loose pips but not the chips is the discipline one has to build a balance between fear and greed.
Attached Image (click to enlarge)
Why i emphasize prop fund is rather loosing your own 2k in real account split into 10 chances and buy a prop firm challenge account of 25K equity every time at nominal price of 100-155$. Upon meeting he required monthly profit target of 10% maintaining the 5% daily draw down, if achieved which will be 2500$ will be shared 80/20 so you will still get 2K by investing a small fee of 155$ (refundable upon first withdrawal) to get 25K equity at FTMO (which is even less at MFF).
Read books and watch videos: of Mark Douglas, Tom Hoougard.
How Larry william makes the world record:
Attached File(s)
3. The Methodology: InnerCircle Trader (ICT)
List of playlist to begin from Youtube:
I Could Go Back & Tell Myself What I Know Now...
https://www.youtube.com/playlist?lis...OMmT1T2m7YpBKJ
2016 Premium ICT Mentorship Core Content Lectures:
https://www.youtube.com/playlist?lis...X0UHQUf31CAEXk
Mentorship 2022:
https://www.youtube.com/playlist?lis...jTF1PGePL3r69s
How Market Maker works:
Market Maker's Concept:
Market Makers manipulate price and trap traders because it is the only way to make massive transactions at a current price level that is desired. “Stop Hunting” a long holder triggers a Sell order because you have to sell in order for you to get out of that trade. While “Stop Hunting” a short holder triggers a buy order because you have to buy in order for you to get out of that trade to protect your account.
That's how breakout traders and stops gets activated which gives MM positions gets in while stop hunting, if still order not enough they keep on grinding till is enough of the accumulation, still not enough will manipulate to wrong side (Turtle Soup as denote by Linda Bradford Raschke/Juda Swing by ICT) until get their fills at best prices only then will give final expansion.
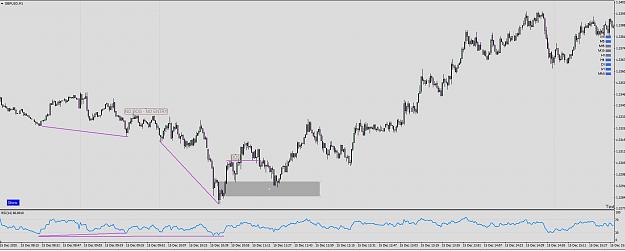
So basically generally before a significant move there is going to be a stop hunt of old highs/lows to caught traders on the wrong side to load their orders and only after that we should look for entries in Lower Time Frame with below rules:
Setup rules below:
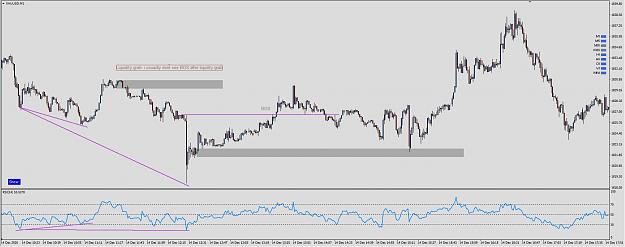
1. look for a Liquidity grab alone or together with an Imbalance is rebalanced
2. wait for a BOS (break of structure) with a FVG
3. then Retest of OB (order block) is our entry.
Summary:
If I summaries what price do in three steps:
1. Price take prev. highs/lows - Stop Hunts
2. Fills the gaps
3. Expands to fill some other fvg or raid swings
While performing above price leaves FVG to fill at a later time is institutional order flow.
There are numerous PD Arrays which helps describe the price, the one i am going to use are only three:
1. Old/Prev swings highs and lows
It can be a high and low of daily/weekly/monthly and since market is fractal we can see H4/H1/M15/M5 swings also to be raided.
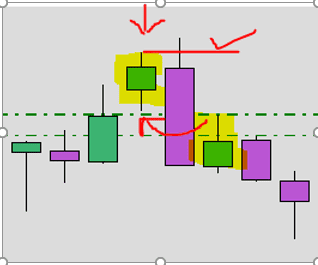
3 Bar swing – when one bar is lower on the left and other bar is lower on the right this indicates that the middle bar has taken the liquidity and hence called 3 bar swing meaning fourth bar can expands and takes its direction, if we notice these on Daily/Weekly we will have our bias and direction.
This is a daily chart where green last up close candle is a Order block and later it turns out to be a 3 bar swing pattern:
Order blocks
The last up close candle is candle is called bearish order block, it is created once price has done step no. 1 above, i.e., stop hunt and similarly the last down close candle will be the bullish order block.
If there are numerous OB in parallel we will only consider the mother OB which has covered all smaller ones.
Attached Image (click to enlarge)
2. Fair value gaps
Fair value gaps created when the next i.e., the 2nd candle moves in one direction with energy and the 3rd candle unable to comes back to tag the first ones wicks… then a fair value gap or imbalance is formed where price delivery is not balanced but delivered one sided only.
Some FVG will not be filled instantly but price will use as support and resistance to target the opposite side of FVG/OB or swing.
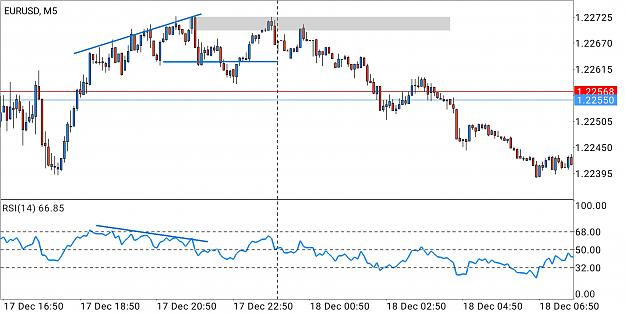
Entry pattern:
Attached Image (click to enlarge)
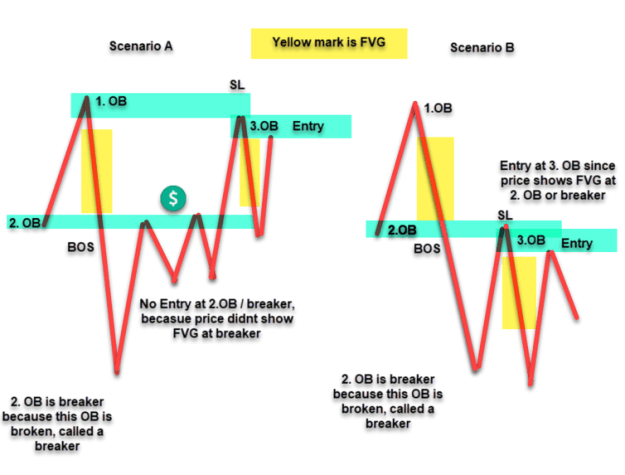
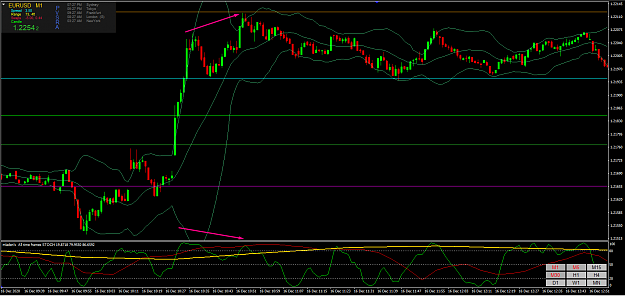
ICT SETUPS:.
Attached Image (click to enlarge)

A short video about the method:
Inserted Video
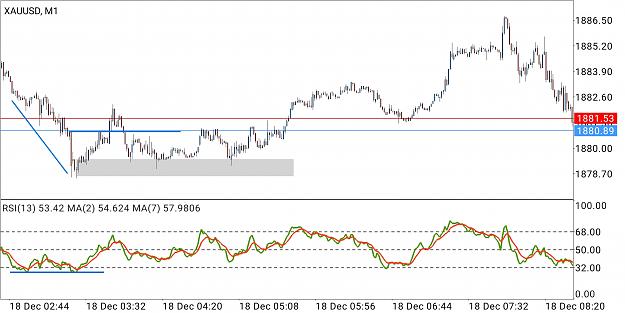
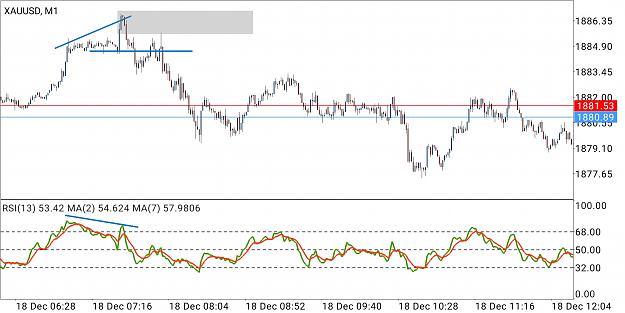
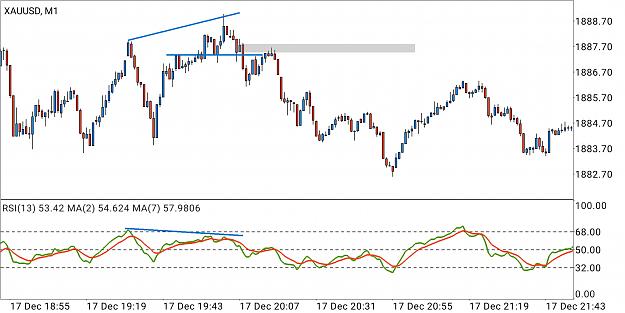
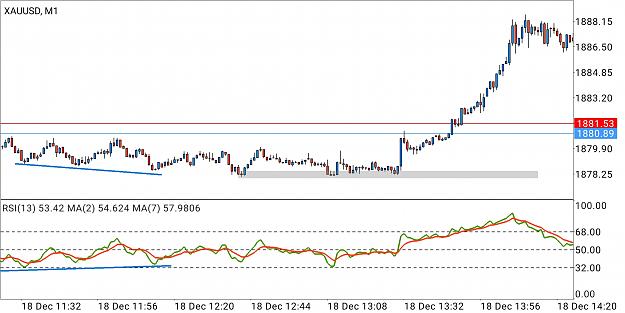
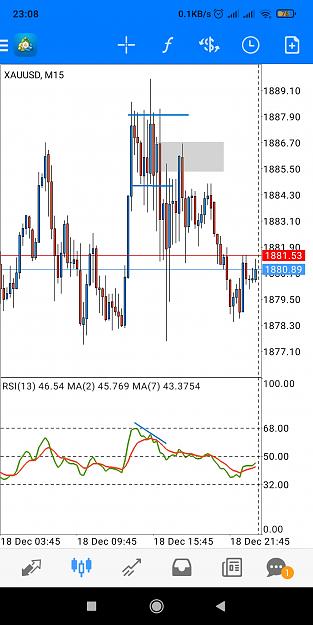
@Note: Please note RSI is not part of ICT, kindly ignore RSI, and follow the rest.
We should add a correlated Pair to see the true divergence i.e., GU/EU, GJ/EJ, US100/US500/US30, AU/NU, Gold/Silver etc, it is added in my template already so dont worry.
Try to always do breakeven once price move away to secure the equity, and book the profit to keep increasing the equity)
Below are the main lessons for Higher time frame Price delivery arrays (PD Arrays) to understand the PRICE from a Premium to Discount point of view.
Step by step lessons starts:
Lesson #1 Stop Hunts \ Liquidity Purge - old high\low - swing points - Rejection block
https://www.youtube.com/watch?v=tmeCWULSTHc&t=2064s
https://www.forexfactory.com/thread/...7#post13595937
Stop Hunt Mastery Book:
https://www.forexfactory.com/thread/...3#post13604053
Lesson #2 Order Block post #1
What is OB: last buy candle in sell trend, and last sell candle in buy
https://www.forexfactory.com/thread/...0#post13591660
Lesson #3 Fair value gap / liquidity void / price inefficiency / imbalance post #124
What is price inefficiency/imbalance/fair value gap
https://www.youtube.com/watch?v=Bkt8B3kLATQ&t=1205s
https://www.forexfactory.com/thread/...6#post13330556
https://www.forexfactory.com/thread/...5#post13591395
https://www.forexfactory.com/thread/...2#post13591422
https://www.forexfactory.com/thread/...8#post13646008
Lesson #4 Breaker Block
https://www.forexfactory.com/thread/...9#post13385929
Lesson #5 Mitigation/Retest of Breaker/Order block
https://www.forexfactory.com/thread/...0#post13332850
Lesson #6 SMT Divergence (Smart money Tool/Technique) / Relative Strength Measurement - (Crack in Market Coorelation)
https://www.forexfactory.com/thread/...7#post13490167
Lesson #7 Power of three (AMD) / Judas Swing / Turtle Soup
https://www.forexfactory.com/thread/...8#post13591088
Lesson #8 Round Number / Fibonacci Levels / Sessions opens / Month closing / Quarter closing
Entry Times (EST | UTC-4)
4:00 - 20:00 - Central Bank Dealers Range
20:00 - 00:00 - Asian kill zone
02:00 - 05:00 - London kill zone - SB hours 3:00-4:00
05:00 - 07:00 - London lunch
07:00 - 10:00 - New York kill zone
10:00 - 12:00 - London Close Kill zone / AM Session Ranges - SB hours 10:00-11:00
12:00 - 13:30 - New York Lunch time
13:30 - 16:00 - Session Ranges - SB hours 14:00-15:00
08:30 - CME opens futures
09:30 - Equity opens
00:00 - 02:00 - Classic Protraction Retracement
02:00 - - Delayed protraction Retracement
00:00 - 15:00 - True day range
15:00 - 16:00 - Bond closing hour
added silver bullets hours
Lesson #9 Seasonality
https://www.forexfactory.com/thread/...1#post13407831
Lesson #10 Daily Bias
https://www.forexfactory.com/thread/...9#post13963249
Lesson #11 Commitment of Traders - Weekly reports / Open Interest (Futures Data)
For Weekly COT Data : https://www.cftc.gov/MarketReports/C...ders/index.htm
For Daily Open Interest Data (except DXY): https://www.cmegroup.com/market-data...fx-volume.html
For Daily DXY only Open Interest Data: https://www.theice.com/marketdata/reports/96
Rules for Open Interest:
A. Bullish Scenario
A1- OI Rising - Prices Rising
A2- OI Falling/Ranging - Prices are falling
A3- OI Falling - Prices are ranging
B. Bearish Scenario (co-incidentally it is inverse of above)
B1- OI Rising - Prices are falling
B2- OI Falling/Ranging - Price are rising
B3- OI Rising - Prices ranging
Read this book, to understand Lesson #11 further
Trade Stocks Commodities with the Insiders - By Larry Williams
Credits:
These method i learn from Michael J Huddleston aka (InnerCircle Trader ICT) - Everyone else online learnt from him and tag as their own.
Youtube channel - https://www.youtube.com/user/InnerCircleTrader
Twitter: @I_Am_The_ICT
FF Thread - https://www.forexfactory.com/thread/562581-trd
Telegram https://t.me/ICT_Official
Price action drill: https://youtu.be/bkt4_qWnVZE
For native listeners ICT method is now also available in easy and short videos in Urdu/Hindi Language as well, kindly follow and subscribe my friends YouTube channels:
Mr Hamid - https://youtube.com/@iamghostof_ICT
Mr Dilshad - https://youtube.com/@noindicatorguy
My Templates and Indicators: (Latest as at 11.04.2024)
Attached File(s)
Order block Marking Indicator and usage: (manual)
OB Indicator: https://www.forexfactory.com/thread/...6#post13784006
How to use: https://www.forexfactory.com/thread/...5#post13784695
Position Sizer-EA: Using this to execute orders - set fixed % of equity as stop amount and set stop loss and, this EA will adjust the lot size accordingly based on SL pips.
Ref: https://www.earnforex.com/metatrader...osition-Sizer/
Back Testing EA:
Who is Michael J. Huddleston: (that's how he define himself)
Attached Image (click to enlarge)

"Exchange of hands"