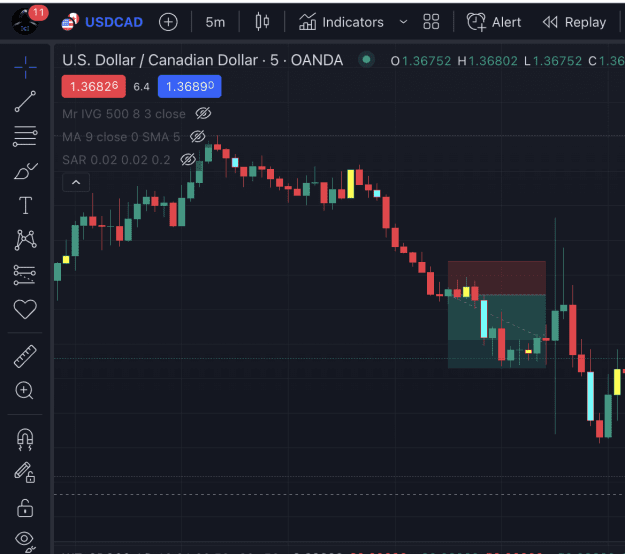
I've taken a trade on USD/CAD which luckily worked in my favour.
Then I am checking back on charts and what do I see? Super weird candle with wicks that go about where my stop loss is.
This is such a weird candle to see and luckily I didn't get stopped out as it hit my TP before. However can someone explain this to me
and why it happens?
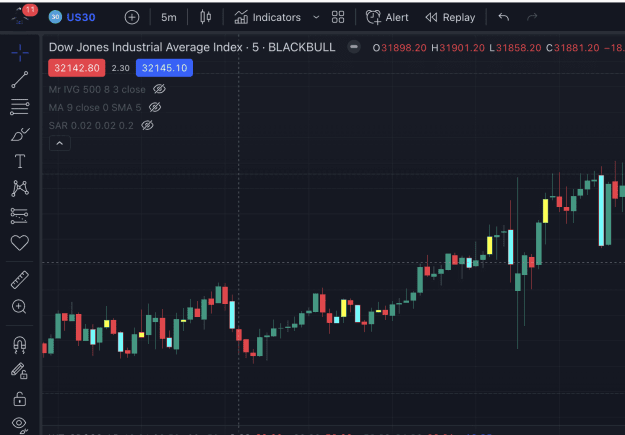
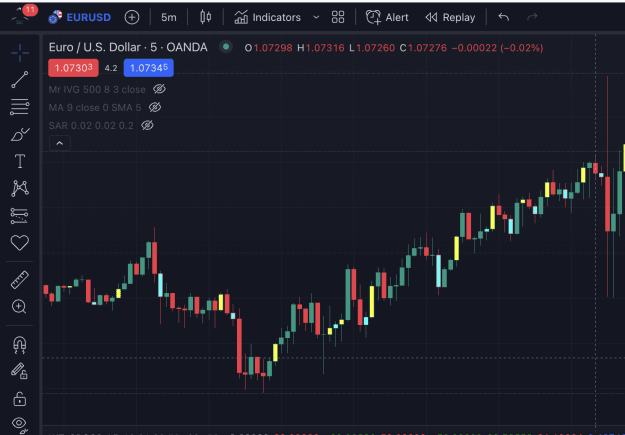
Same candle happens on US30 (at the same time), GBPUSD, EURUSD, etc.
Then I am checking back on charts and what do I see? Super weird candle with wicks that go about where my stop loss is.
This is such a weird candle to see and luckily I didn't get stopped out as it hit my TP before. However can someone explain this to me
and why it happens?
Same candle happens on US30 (at the same time), GBPUSD, EURUSD, etc.
Attached Image(s) (click to enlarge)