and eurgbp sell 0.6830 sl 0.6854 tp 0.6810
and chfjpy buy 99.03 sl 98.55 tp 99.51
Ignored
i chose not to trade the chf/jpy since i got in the gbp/jpy. although the eur/gbp does give a white signal, the weekly stochs is still pointing north so i didn't get in
oops, what time zone of your MT is? my is GMT +2.
I'm testing this system on all forex pairs. I want to look at these results.
Ignored
i'm using FXDD which is GMT-3 i believe. FXDD daily candle close is at 5pm est.
I too am testing all pairs except the peso. The more the merrier for learning. I think i'm not waiting for the weekly stochs to develop. if they are touching or barely crossing the i get in on the daily. it may be wiser to wait until they are crossed and showing clear direction.
i entered the eur/jpy and eur/chf. both were white signals and short entries. Both had their weekly stoch barely crossed. i set the stop on the e/j 5 pips above the high and on the rur/chf, i used 5 pips above the 78% retracement.
It would be more conservative and with a higher probability to wait until the weekly had a stronger signal. we'll see
I entered new positions too. They are:
eurjpy sell
eurchf sell
usdchf buy
chfjpy sell.
03.05.2007 closed positions usdchf +49 pips tp chfjpy +4 pips reverse
I don't use any other indicators. I think I must check this system out at first without any other indicators. And then, when I'll understand this system for me, i will check some filters.
Pipette, what about money management?
I risk one position 5% of my deposit and now system is + 6% to deposit (for 2 days )
and it's demo. what about you?
Would you be so kind as to post your results on this thread?
BTW, your call on USDCHF being a white signal is correct.
Ignored
DojiStar hi! yes, i will post my results.
i opened demo account for this system. initial deposit is 10000. in my broker company i can open position 0.01 lot with step 0.01. it's cool. because i can open position for example 1.26 lot
and i risk in 1 position no more 5% of current account equity.
when i see a signal from system, i count what stop loss level will be and count my volume of lots.
For example:
i see a signal from eurjpy with stop loss 47 pips. if 47 pips is 5% of my equity (for exapmle my equity is $11057) 1 pip must be 0.1064% of equity. it's $11.76. and 1 pip on eurjpy (with 1 lot volume) is $8.31. so i must open position with volume $11.76/$8.31 = 1.42 lots
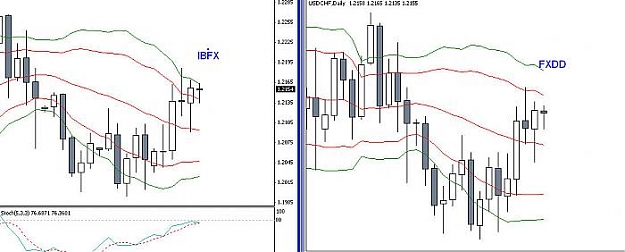
i just went to IBFX and FXDD and loaded the same indicators and took a snapshot of both. there's a big difference between them. The candles only differ by 1-2 pips. Does anyone have a potential explanation?
what brokers are you using for your charts? i'd prefer to be on the same page as others.
i just went to IBFX and FXDD and loaded the same indicators and took a snapshot of both. there's a big difference between them. The candles only differ by 1-2 pips. Does anyone have a potential explanation?
what brokers are you using for your charts? i'd prefer to be on the same page as others.
Ignored
i have real account in Water House Capital. and opening demo of course there
|
Joined Apr 2006
|
Status: Constantly learning
|150 Posts
Quote
Disliked
i just went to IBFX and FXDD and loaded the same indicators and took a snapshot of both. there's a big difference between them. The candles only differ by 1-2 pips. Does anyone have a potential explanation?
There may be many different ways to calculate the indicators... close, open, median and so on...
And maybe they include weekends data in the calculations... ?
And maybe they include weekends data in the calculations... ?
Ignored
spot on. IBFX includes a small sunday candle on charts, thus slightly throwing off calculations of indicators as compared to brokers that do not have this small candle.
in looking at pipette's comparison you easily see that FXDD does not have these candles compared to IBFX, and that is where the difference plays out.
Ignored
good observation, thanks. so the question is, which way is the best way to go? is the tiny sunday candle skewing the data since it consists of 2 hours of data on IBFX? FXDD daily candle update is 5pm so when the market opens, it's already started on monday's candle.
good observation, thanks. so the question is, which way is the best way to go? is the tiny sunday candle skewing the data since it consists of 2 hours of data on IBFX? FXDD daily candle update is 5pm so when the market opens, it's already started on monday's candle.
Pipette
Ignored
it's up to you really. it's your preference which to go by. if you wish to use IBFx I would go back a bit and manually backtest the method to ensure it still works for you in the correct manner. i would believe it should, you may just not get every signal that other brokers get.
i myself don't trade the Steroids method at the moment, I'm still using Kevin's previous BB method with a little price action and fibo fans on the side. I've been using IBFX with it from the start and it works just the way it was intended regardless of weekend data.
Hello,I was happy to find this system and have read the thread thoroughly but am still not clear on a couple of issues.
1. On the 4th page of the original system, the chart displayed to explain "blue signals" has me confused. There are two red arrows which are described as losing trades but they are neither white or blue signals i.e not white because they close outside the white BB's and not blue because they have touched the white BB's.
2.On the third page the chart used to describe "white signals" is also not clear to me.I understand the two green arrows denoting a white signal to buy,but the first two red arrows indicate a "white signal" to sell on a green candle.Is this becuase the candles close in the upper half of the BB channels?
3. On the same chart the third red arrow points to a "white signal" sell.Why a sell and not a buy? Is this a sell because the candle is red?
I hope some one understands what I'm getting at and can clarify this for me.
Cheers.
Hello,I was happy to find this system and have read the thread thoroughly but am still not clear on a couple of issues.
1. On the 4th page of the original system, the chart displayed to explain "blue signals" has me confused. There are two red arrows which are described as losing trades but they are neither white or blue signals i.e not white because they close outside the white BB's and not blue because they have touched the white BB's.
2.On the third page the chart used to describe "white signals" is also not clear to me.I understand the two green arrows denoting a white signal to buy,but the first two red arrows indicate a "white signal" to sell on a green
candle.Is this becuase the candles close in the upper half of the BB channels?
3. On the same chart the third red arrow points to a "white signal" sell.Why a sell and not a buy? Is this a sell because the candle is red?
I hope some one understands what I'm getting at and can clarify this for me.
Cheers.
Ignored
hi
Let me take a stab at it.
1. pg 4. these are valid blue signals because they closed outside the blue channel and outside the white channel, thus they are valid sells. had they closed within the blue and white BBs then they would have been white sells. So for a blue signal it must close outside of blue, unless by closing between the blue and white and having touched the white BB, in which case then it be a white signal, which overrides blue signals.
2. pg 3. the 2 red signals are valid white signals because they both touched the white BB then closed within the white channel. it doesn't matter about candle color
3. pg 3, third red candle is a valid white signal to sell because price came through the upper white BB and closed within the white channel. color of candle does not come into play.
So the best way to understand this method initially is to have 2 charts, one with the white BBs and one with the blue BBs. I got confused between the 2 and this was the easiest way to understand since one has nothing to do with the other. The only time that it gets a little confusing is when the candle touches the white BB but closes outside the blue BB, so you get a white and a blue signal, but again, White supersedes blue.