hi
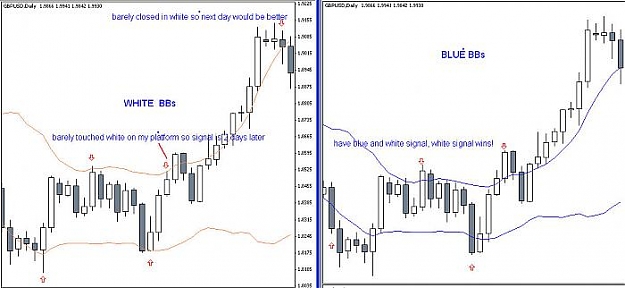
I've attached a snapshot that shows this same period on 2 charts. I put the white BBs on one chart and the blue BBs on a separate chart. you'll see it's much easier to understand it this way. you'll see the one spot where a blue and white signal are both given.
I hope this helps clarify
Pipette
I've attached a snapshot that shows this same period on 2 charts. I put the white BBs on one chart and the blue BBs on a separate chart. you'll see it's much easier to understand it this way. you'll see the one spot where a blue and white signal are both given.
I hope this helps clarify
Pipette
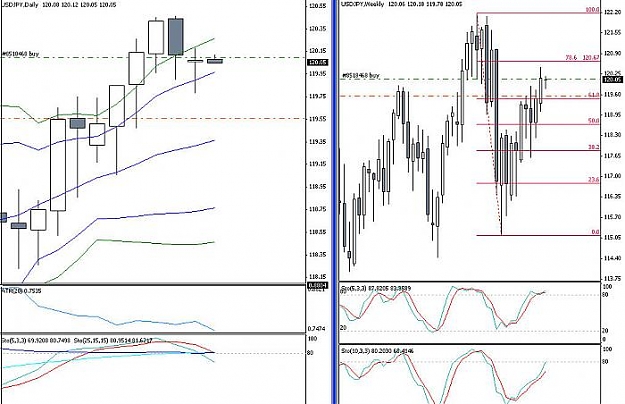
Attached Image (click to enlarge)