Hi TEB,
Think you may have put the hourly blue line in the wrong place on the 5m chart example above.
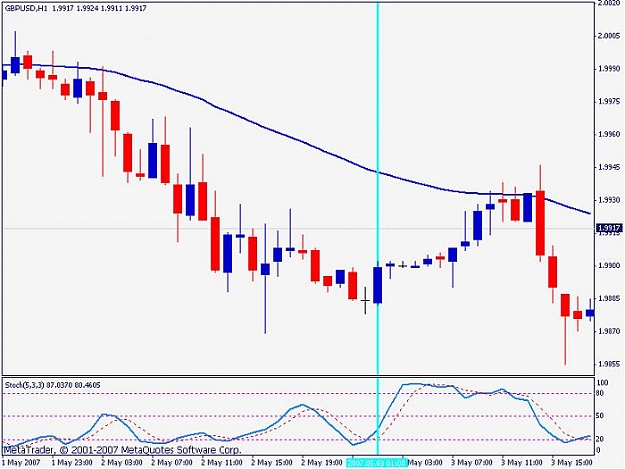
You have the blue line on the hourly signal candle i.e 00.00 open and 01.00 close.
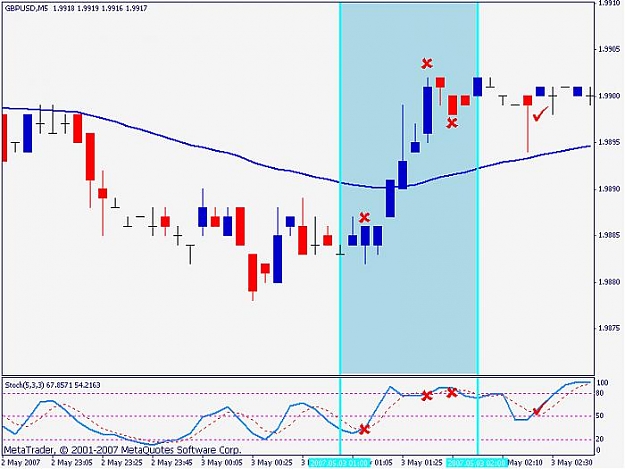
But on the 5m chart it is still showing on the 00.00 candle which is 00.00 open and 00.05 close, 55 minutes before the direction is given on the end of the hourly candle.
Hope this makes sense.
In this example if you wait for the hourly candle to close the 5m blue line needs to be on the 00.55-01.00 candle.
Think you may have put the hourly blue line in the wrong place on the 5m chart example above.
You have the blue line on the hourly signal candle i.e 00.00 open and 01.00 close.
But on the 5m chart it is still showing on the 00.00 candle which is 00.00 open and 00.05 close, 55 minutes before the direction is given on the end of the hourly candle.
Hope this makes sense.
In this example if you wait for the hourly candle to close the 5m blue line needs to be on the 00.55-01.00 candle.