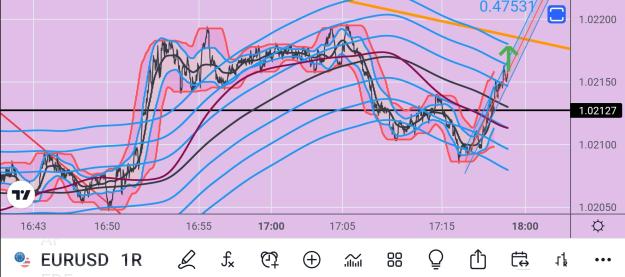
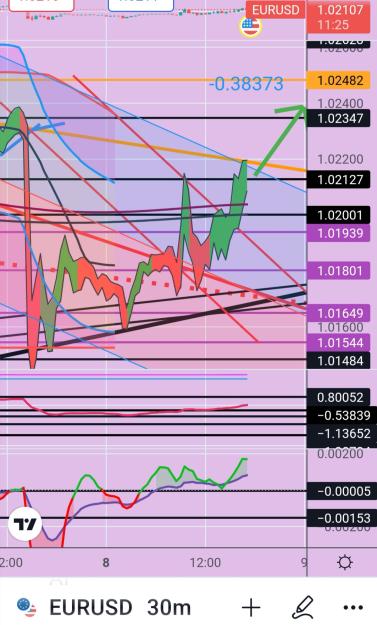
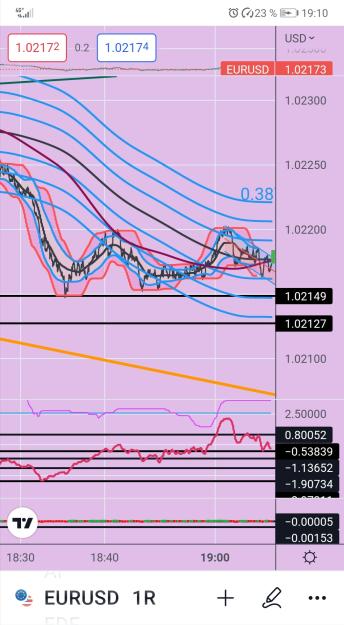
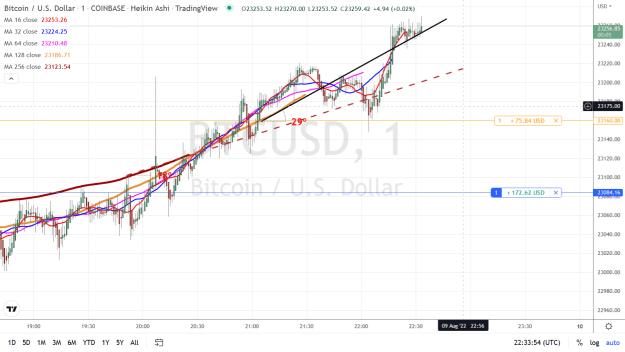
The orange oblique was under surveillance (figure on old graphs).
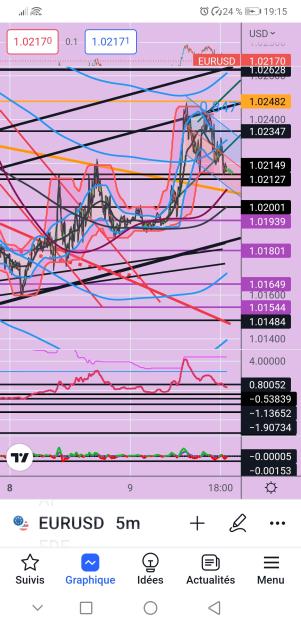
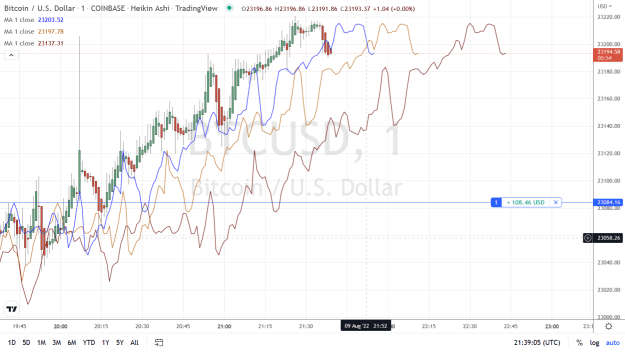
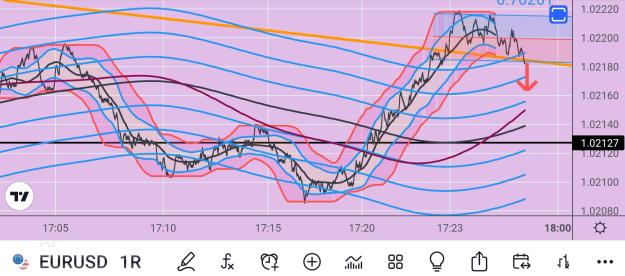
Several focal points were also helpful. (time units 3mn to 30mn).
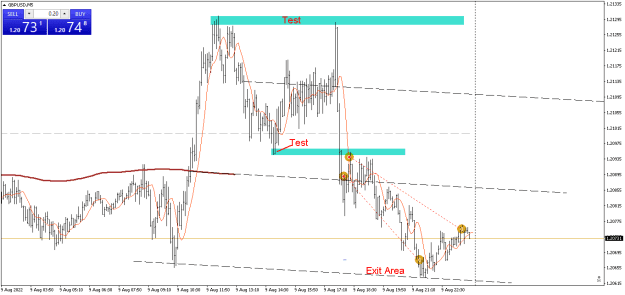
1
Planetary cycles, astrological theory of cycles of the markets 502 replies
Forecast Forex using Numeric Cycles and Astrology Cycles 36 replies
Planetary Cycles... Plotting Cycles into the Future 0 replies
Market Waves are NOT Cycles 8 replies
Waves/Trends/Cycles 0 replies
DislikedI once again noticed a slight TView Bug. (small vertical instability of the oblique). Estimated less than 1pip.Ignored
Disliked{quote} Dave I see CCurv from Blue Rocket as a kind of Murrey Math Lines integrating the Underlying Trend in Price Action and evaluating the position of Price Action within the Maximum Estimated Amplitude of the Time Frame used.Ignored
DislikedMaybe this W. (If you don't see anything on my graphs look at the arrow and blue oblique) {image} Or maybe not at this time {image}Ignored
DislikedNothing special here but a good illustration of trades available after all the big guys go home....these two, total 4 lots, was so easy to spot why? Just because of the 256 CENTERED MOVING AVERAGE on my 5 min chart along with the angle of the extension on the fib channel. Certainly no home run, but pays for gas next week...+18 on 2 and +24 on two. Once again I was having coffee with my wife on the best entry....just gotta stop that bad habit..lol You know, the CMA, along with using your fib channel can really give you spots not only to get in carefully,...Ignored