The Stop Loss Cluster indicator is now available for MT4 and MT5.
It’s a piece of common knowledge in the financial trading world that the Stop Loss level of some traders is potentially the Take Profit level of others. This can be tricky since the Stop Loss and Take Profit levels of other traders aren’t visible on MetaTrader platforms.
To this end, the Stop Loss Clusters (SLC) indicator is designed to display the level where significant numbers of Stop Losses are placed by other traders. This in turn gives you a clearer perspective when making trade decisions as per setting your Stop Loss or Take Profit.
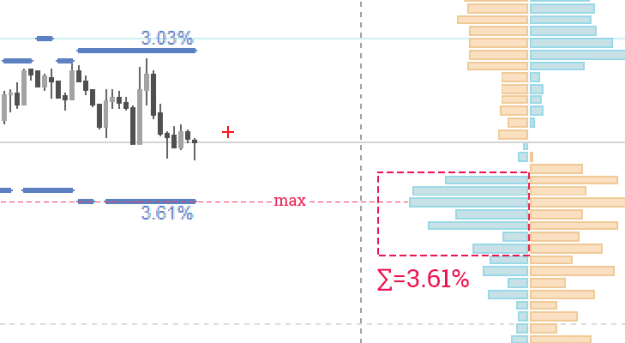
The Stop Loss Cluster indicator relies on Data from the Order Book to identify significant areas where other traders have placed their Stop Losses. It represents these Stop Losses in a blue histogram directly on the MT4 chart. The indicator’s algorithm searches through the Order Book for levels that hold the maximum trading volume and displays them on the chart.
Features of Stop Loss Cluster Indicator
The indicator is built with several interesting features. However, we’ll focus on the salient features. Besides, the indicator is also integrated with an automatic update feature to automatically download the latest features.
Cluster Volume: This feature (which comes in a different dimension of lines) helps the user to visualize the price level and volume where the clusters are formed.
Cluster Stages: The indicator is built to display three phases of clusters which are duly represented with lines of different widths.
Label and hint: This feature enables a text display function to show the volume size of the price on the chart. Furthermore, the volume of trades of any candlestick can also be seen by hovering over the Stop Loss Cluster indicator.
How To Trade With The Stop Loss Cluster Indicator
To start with, the Stop Loss Cluster indicator isn’t a signal-generating tool per se. It’s rather a technical tool designed to give you visuals of where Stop Loses is placed.
In essence, the Stop Loss Cluster indicator would come in handy when you want to set a Stop Loss for a trade. It helps you to avoid levels where your Stop Loss has higher susceptibility of being triggered due to false movement by the price. With this indicator, you can simply set your Stop Loss at a level where fewer Stop Losses of other traders are placed. Regardless, ensure your Stop Losses are also within the range of your risk-to-reward ratio.
In the same vein, the Stop Loss Cluster can also give you a clear-cut spot for placing your Take Profit. You simply set your Take Profit at the level of the Stop Loss Cluster. With this, your Take Profit has a higher probability to be triggered.
Stop Loss Cluster Indicator Settings
1-3 Stage Minimum Volume: This parameter is used to define the line width used by the indicator when displaying the Stop Loss clusters on the chart at a different trading volume. The value of the minimum volume is recommended to be used for the three cluster phases of the indicator.
Line Width Pattern: This is used to set the pixels of the line width for the three cluster phases. This variable is recommended to be set in ascending order.
Limit Displayed Data: This is used to set the data history depth to be displayed by the indicator.
Color Scheme: This parameter is used to select any color scheme of your choice from the color option. The indicator is however configured to automatically assign a color scheme that is in sync with your MT4 chart background.
Line Color: This parameter is used to assign a color to the indicator lines.
Indicator installation
Download Link
1. Download and unzip the archive to the MQL4 folder of the terminal;
2. Restart the terminal and run the indicator;
3. Allow import of DLLs.
It’s a piece of common knowledge in the financial trading world that the Stop Loss level of some traders is potentially the Take Profit level of others. This can be tricky since the Stop Loss and Take Profit levels of other traders aren’t visible on MetaTrader platforms.
To this end, the Stop Loss Clusters (SLC) indicator is designed to display the level where significant numbers of Stop Losses are placed by other traders. This in turn gives you a clearer perspective when making trade decisions as per setting your Stop Loss or Take Profit.
The Stop Loss Cluster indicator relies on Data from the Order Book to identify significant areas where other traders have placed their Stop Losses. It represents these Stop Losses in a blue histogram directly on the MT4 chart. The indicator’s algorithm searches through the Order Book for levels that hold the maximum trading volume and displays them on the chart.
Attached Image (click to enlarge)
Features of Stop Loss Cluster Indicator
The indicator is built with several interesting features. However, we’ll focus on the salient features. Besides, the indicator is also integrated with an automatic update feature to automatically download the latest features.
Cluster Volume: This feature (which comes in a different dimension of lines) helps the user to visualize the price level and volume where the clusters are formed.
Cluster Stages: The indicator is built to display three phases of clusters which are duly represented with lines of different widths.
Label and hint: This feature enables a text display function to show the volume size of the price on the chart. Furthermore, the volume of trades of any candlestick can also be seen by hovering over the Stop Loss Cluster indicator.
How To Trade With The Stop Loss Cluster Indicator
To start with, the Stop Loss Cluster indicator isn’t a signal-generating tool per se. It’s rather a technical tool designed to give you visuals of where Stop Loses is placed.
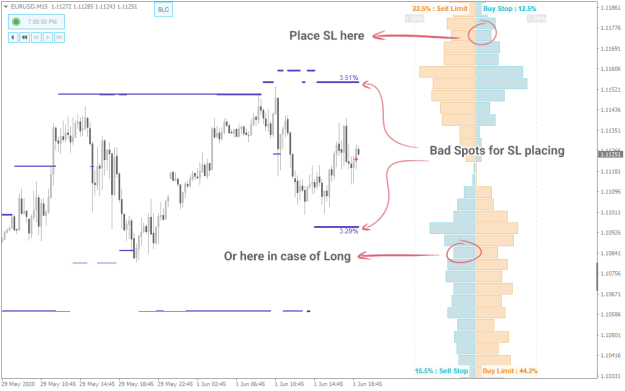
In essence, the Stop Loss Cluster indicator would come in handy when you want to set a Stop Loss for a trade. It helps you to avoid levels where your Stop Loss has higher susceptibility of being triggered due to false movement by the price. With this indicator, you can simply set your Stop Loss at a level where fewer Stop Losses of other traders are placed. Regardless, ensure your Stop Losses are also within the range of your risk-to-reward ratio.
Attached Image (click to enlarge)
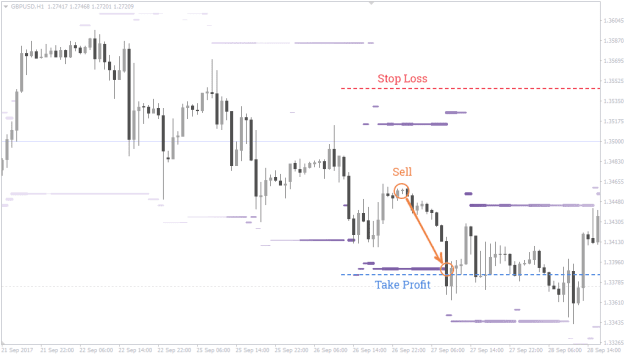
In the same vein, the Stop Loss Cluster can also give you a clear-cut spot for placing your Take Profit. You simply set your Take Profit at the level of the Stop Loss Cluster. With this, your Take Profit has a higher probability to be triggered.
Attached Image (click to enlarge)
Stop Loss Cluster Indicator Settings
Attached Image (click to enlarge)
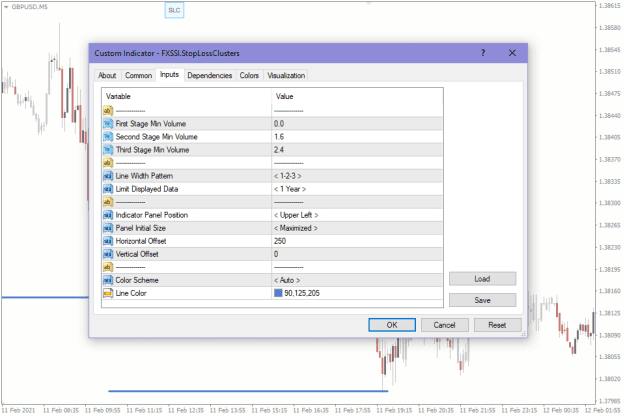
1-3 Stage Minimum Volume: This parameter is used to define the line width used by the indicator when displaying the Stop Loss clusters on the chart at a different trading volume. The value of the minimum volume is recommended to be used for the three cluster phases of the indicator.
Line Width Pattern: This is used to set the pixels of the line width for the three cluster phases. This variable is recommended to be set in ascending order.
Limit Displayed Data: This is used to set the data history depth to be displayed by the indicator.
Color Scheme: This parameter is used to select any color scheme of your choice from the color option. The indicator is however configured to automatically assign a color scheme that is in sync with your MT4 chart background.
Line Color: This parameter is used to assign a color to the indicator lines.
Indicator installation
Download Link
1. Download and unzip the archive to the MQL4 folder of the terminal;
2. Restart the terminal and run the indicator;
3. Allow import of DLLs.